The PEG Ratio Explained: P/E Adjusted for Growth
The price-to-earnings ratio, or P/E, is the first valuation number most beginners meet. But on its own it has a blind spot: it says nothing about how fast a company is growing. A stock with a high P/E can be a bargain if profits are racing ahead, while a low P/E can be a trap if the business is stuck. The PEG ratio was invented to fix that blind spot by folding growth into the picture. Here is how it works, in plain language.
First, a quick refresher on P/E
The P/E ratio is simply the share price divided by the company's earnings (profit) per share. If a stock trades at Rs 400 and earns Rs 20 per share, its P/E is 400 ÷ 20 = 20. A rough way to read it: you are paying Rs 20 for every Rs 1 of current annual profit. A higher P/E means the market is paying more for each rupee of earnings — usually because it expects those earnings to grow.
That last phrase is the whole problem. P/E reflects growth expectations but never tells you what growth rate would justify the price. Two companies can both have a P/E of 40 — one growing fast, one barely moving — and P/E alone treats them as identical.
What the PEG ratio adds
The PEG ratio (Price/Earnings-to-Growth) divides the P/E by the company's earnings growth rate:
PEG = P/E ÷ earnings growth rate
The growth rate is entered as a plain number, not a percentage sign — so 20% growth is written as 20. The idea, popularised by fund manager Peter Lynch, is elegant: a fair price for a growth company is one where the P/E roughly matches the growth rate. When they match, PEG is about 1.
The common rule of thumb:
- PEG near 1 — the price and the growth are roughly in balance.
- PEG below 1 — you may be paying relatively little for the growth on offer.
- PEG above 1 — the price is high relative to the growth, so more optimism is already baked in.
Analogy: P/E is the sticker price on a car; PEG is the price adjusted for how powerful the engine is. A pricey car with a monster engine can be better value than a cheap one that barely moves.
A worked example
Compare three fictional companies. Watch how PEG reorders them:
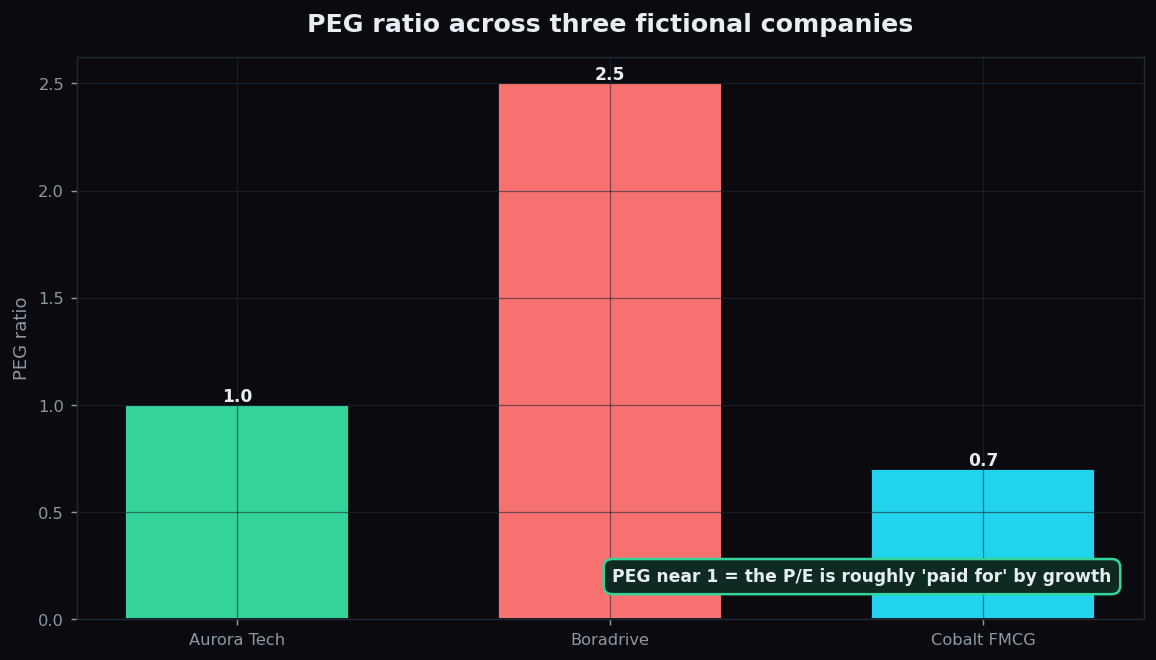
- Aurora Tech: P/E of 40, profits growing 40% a year. PEG = 40 ÷ 40 = 1.0.
- Boradrive: P/E of 25, profits growing 10% a year. PEG = 25 ÷ 10 = 2.5.
- Cobalt FMCG: P/E of 21, profits growing 30% a year. PEG = 21 ÷ 30 = 0.7.
Judged by P/E alone, Aurora Tech (40) looks the most expensive and Cobalt (21) the cheapest. But once growth is included, the ranking flips.
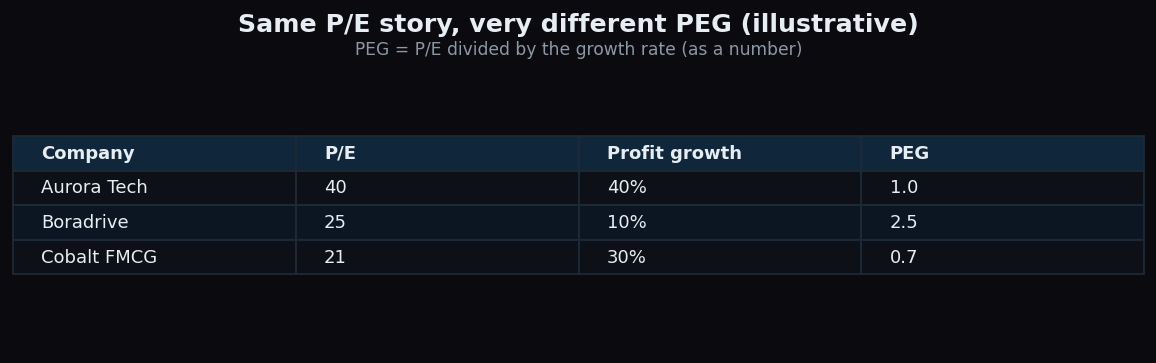
Aurora's high P/E is backed by fast growth, giving a balanced PEG of 1.0. Cobalt combines a modest P/E with strong growth, producing the lowest PEG at 0.7. Boradrive, which looked reasonably priced on P/E, has the highest PEG at 2.5 because its growth is slow — you are paying a lot for a little expansion. The PEG lens tells a very different story from P/E alone.
How investors use it
PEG is mainly a screening and comparison tool:
- Comparing growth stocks. It is most useful for companies with meaningful, positive earnings growth, where P/E alone feels incomplete.
- Sanity-checking a scary P/E. A P/E of 50 sounds alarming until you see the company growing 50% a year, giving a PEG of 1.
- Ranking within a sector. Among similar businesses, PEG offers a quick, growth-aware ordering.
The honest catch
PEG looks precise, but it leans on a soft input — the growth rate — and that makes it fragile.
- The growth number is a guess. Future growth is an estimate. Use an optimistic forecast and PEG magically looks cheap. Small changes in the assumed growth rate swing the answer a lot.
- It breaks for slow or shrinking companies. If growth is near zero or negative, the maths gives huge or meaningless PEG values. It suits growth firms, not steady utilities.
- It ignores risk and quality. Two companies can share a PEG of 1 while one has heavy debt and volatile profits. PEG says nothing about how reliable the growth is.
- Time horizon matters. One year of growth versus a multi-year average can produce very different PEG figures for the same stock.
So PEG is best treated as a starting question, not a verdict: is this P/E reasonable given how fast the company is really growing? It pairs naturally with a look at whether that growth actually produces cash, and with a healthy dose of scepticism about the growth forecast.
Ratios describe a company; live market structure describes how its stock behaves day to day. TrueTrend turns raw market data into plain-English context so you can learn the mechanics without the jargon. Create a free account to explore.
Key takeaways
- The PEG ratio = P/E ÷ earnings growth rate, adjusting the P/E for how fast a company is growing.
- PEG near 1 means price and growth are roughly balanced; below 1 is cheaper for the growth, above 1 is dearer.
- In our example, a P/E of 40 with 40% growth (PEG 1.0) was better balanced than a P/E of 25 with 10% growth (PEG 2.5).
- PEG works best for companies with genuine, positive earnings growth.
- Its weak point is the growth estimate — change the forecast and the answer moves; it ignores risk and debt.
See these concepts on live market data — free
Create a free TrueTrend account to watch daily support/resistance levels, market regime, and option-positioning charts on NIFTY, BankNifty and 12 more instruments. Every level we publish is scored on a public scoreboard — misses included. No card required.
Free forever tier · daily levels with published hit-rates across every instrument. Descriptive market structure, not investment advice.
Not ready for an account? Get the daily levels by email.
One short email each market day — the indices' call wall, put wall, gamma flip and max pain, and how the last session's levels scored. Free, no account, unsubscribe anytime.
Descriptive market structure, not investment advice. We never share your email.