Pivot Points Explained for Intraday Levels
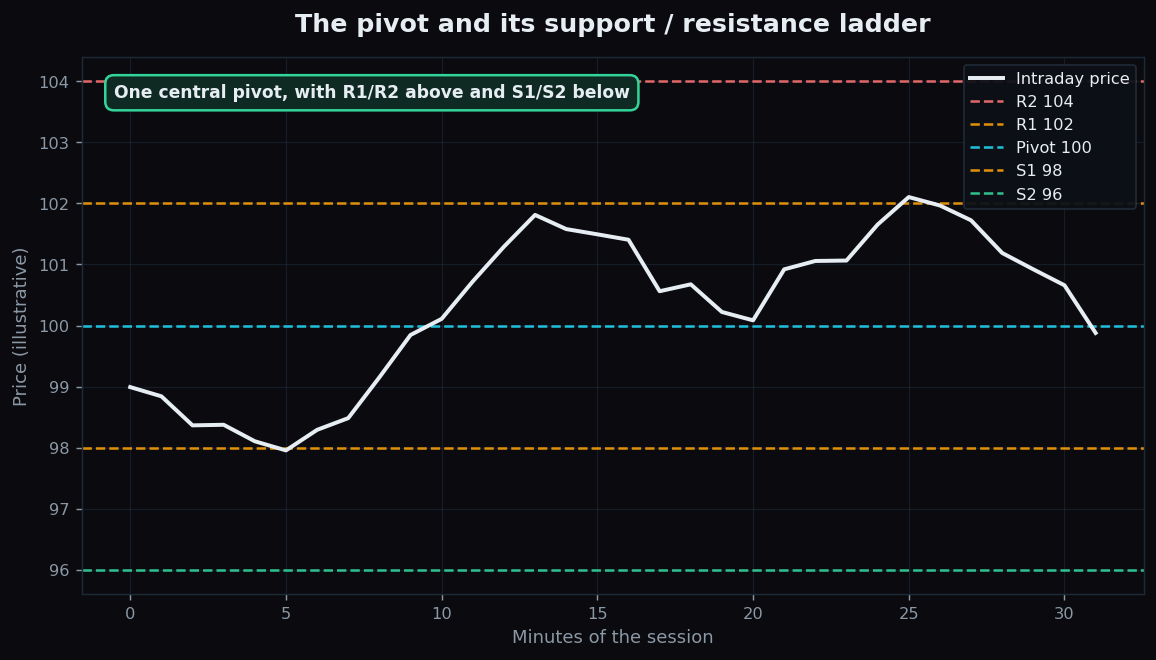
Intraday traders need to make decisions fast, and most of them lean on a small set of horizontal lines drawn on the chart before the day even begins. The most popular of these is the pivot point — a single reference level, surrounded by a ladder of support and resistance lines, all calculated from yesterday's price. It is one of the oldest and simplest tools in technical analysis, and it remains a favourite precisely because it is mechanical: the same formula gives everyone the same lines.
What a pivot point is
A pivot point is a calculated price level that acts as the day's rough centre of gravity. The idea is simple: yesterday's trading tells you the zone where buyers and sellers were active, so the average of yesterday's extremes is a sensible anchor for today.
The classic (illustrative) formula uses only three numbers from the previous session — the high, the low, and the close:
- Pivot (P) = (High + Low + Close) ÷ 3
- Resistance 1 (R1) = (2 × P) − Low
- Support 1 (S1) = (2 × P) − High
From there, further levels (R2, S2 and beyond) extend the ladder outward. You do not need to memorise the arithmetic — every charting platform plots these automatically. What matters is the picture they create.
The result is a tidy ladder: one central pivot, with resistance levels stacked above (R1, R2) and support levels stacked below (S1, S2). Think of it like floors in a building. The pivot is the lobby; R1 and R2 are the floors above; S1 and S2 are the basement levels below. Price spends the day riding the lift between them.
A worked example with round numbers
Suppose yesterday an index finished with a high of 102, a low of 96, and a close of 102. Plug those in:
- Pivot = (102 + 96 + 102) ÷ 3 = 100
- R1 = (2 × 100) − 96 = 104
- S1 = (2 × 100) − 102 = 98
So today's map is a pivot at 100, first resistance at 104, and first support at 98. Before the session even opens, a trader already has three meaningful reference prices to watch. (These round numbers are an example to show the arithmetic, not a forecast for any real instrument.)
How intraday traders read the levels
Pivot levels are used as reference points, not magic walls. A few common ways traders interpret them:
- The pivot as a bias line. Many traders treat trading above the pivot as a broadly constructive day and below it as a broadly heavy day — a quick read on the session's mood.
- Support and resistance to watch. When price drifts down toward S1 and steadies, that level is "doing its job" as support. When price rallies into R1 and stalls, R1 is acting as resistance.
- Break or bounce. The interesting moments are when price reaches a level. Does it bounce away (the level holds) or push straight through (the level breaks)? A clean break of R1 often turns attention to R2 as the next reference.
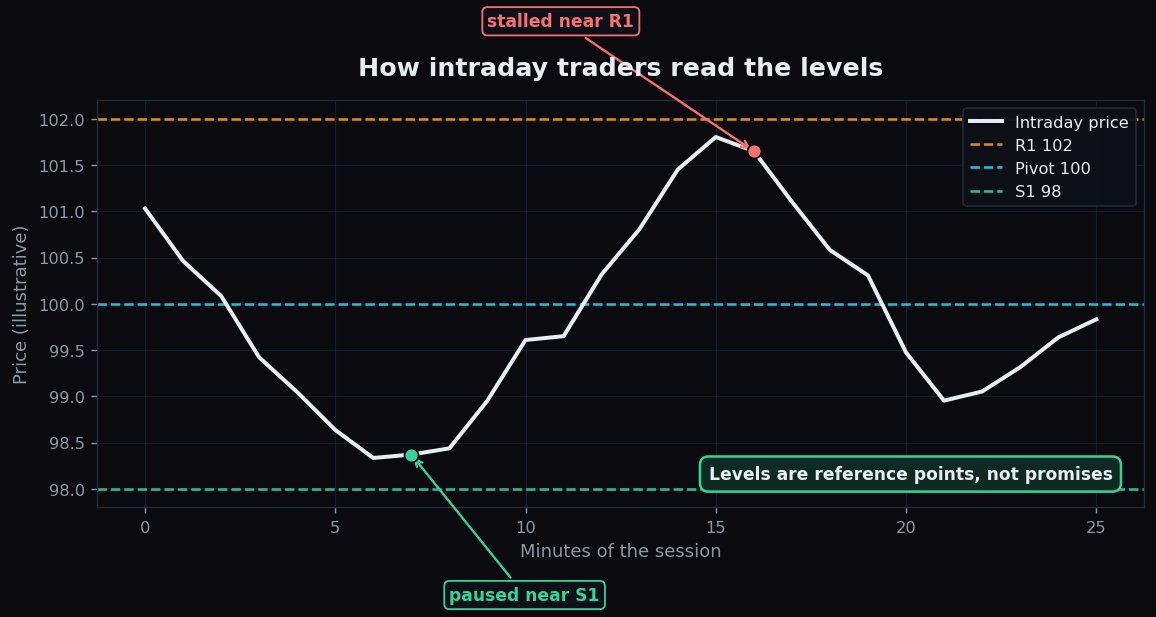
In the chart above, price eases down to S1, steadies, then climbs and runs out of steam near R1. Notice that the levels did not force anything — they simply marked the spots where the tug-of-war between buyers and sellers got interesting. That is the right way to think about them: as a pre-drawn map of zones to pay attention to.
Why so many traders use them
Pivot points are popular for three down-to-earth reasons. First, they are objective — the formula removes guesswork, so there is nothing to draw by hand and nothing to argue about. Second, they are forward-looking: you have all of today's levels before the first trade, which suits the speed of intraday work. Third, there is a self-fulfilling element — because so many participants watch the same widely-known levels, those levels can attract activity simply by being watched.
The honest catch
- They are just arithmetic on old data. Pivots know nothing about today's news, earnings, or a surprise global headline. A strong catalyst can blow through every level as if it were not there.
- Levels break as often as they hold. "Price reached S1" tells you where to watch, not what will happen next.
- There are many variants. Classic, Fibonacci, Camarilla and other pivot formulas all plot slightly different lines, so "the" pivot depends on the recipe used.
- They work best as confluence. A pivot level that lines up with another clue — a round number, a prior high, a moving average — carries more weight than a pivot sitting alone.
Used sensibly, pivot points are a clean, shared map of the day. Used blindly, they are just lines that price ignores whenever it feels like it.
Reference levels are most useful when you can see how price has actually behaved around them over many sessions. TrueTrend publishes a transparent, education-first scoreboard so you can study level behaviour over time instead of trusting any single chart — have a look and judge for yourself.
Key takeaways
- A pivot point is a reference level calculated from yesterday's high, low and close — the day's rough centre of gravity.
- Around it sits a ladder: R1, R2 above (resistance) and S1, S2 below (support).
- Traders use them as a bias line and as zones to watch for a bounce or a break, not as guaranteed walls.
- They are popular because they are objective, available before the open, and widely watched.
- They are only arithmetic on past data — news can override them, and this article is education, not advice.
See these concepts on live market data — free
Create a free TrueTrend account to watch daily support/resistance levels, market regime, and option-positioning charts on NIFTY, BankNifty and 12 more instruments. Every level we publish is scored on a public scoreboard — misses included. No card required.
Free forever tier · daily levels with published hit-rates across every instrument. Descriptive market structure, not investment advice.
Not ready for an account? Get the daily levels by email.
One short email each market day — the indices' call wall, put wall, gamma flip and max pain, and how the last session's levels scored. Free, no account, unsubscribe anytime.
Descriptive market structure, not investment advice. We never share your email.