Position Sizing Explained: How Much to Risk
Two traders can hold the exact same view on the exact same stock and one ends the year richer while the other blows up. Often the difference is not the idea at all — it is position sizing: how much you put on a single idea. Sizing is the quiet lever that turns a good strategy into a survivable one. This post explains what position sizing is, the popular 1% rule, and a simple worked example. Everything is illustrative and educational — not advice on how much anyone should risk.
What position sizing means
Position sizing is deciding how large a trade or holding should be, measured by the amount you could lose if it goes wrong — not by how confident you feel. A common beginner mistake is to size by excitement: a strong hunch gets a big bet, a weak one gets a small bet. Disciplined sizing flips this. It starts from a fixed amount of money you are willing to lose on any single idea, then works backwards to a quantity.
The key term is your risk per trade — the rupees you would lose if the idea hits its exit level. Notice this is different from the value of the position. You might control 50,000 worth of stock while only risking 1,000, because your planned exit is close to your entry.
The 1% rule, explained simply
A widely taught starting point is the 1% rule: risk no more than 1% of your account on any single idea. It is not a magic number — some use 0.5%, some 2% — but 1% is a clean illustration. The logic is survival. If each idea can only dent your account by 1%, then even a brutal run of ten losses in a row costs roughly 10%, which is recoverable. Risk 10% per idea instead, and that same losing streak nearly wipes you out.
Here is the crucial insight beginners miss: the 1% rule sets your risk budget, but the distance to your exit sets your quantity. Those are two separate steps.
The formula, in plain words
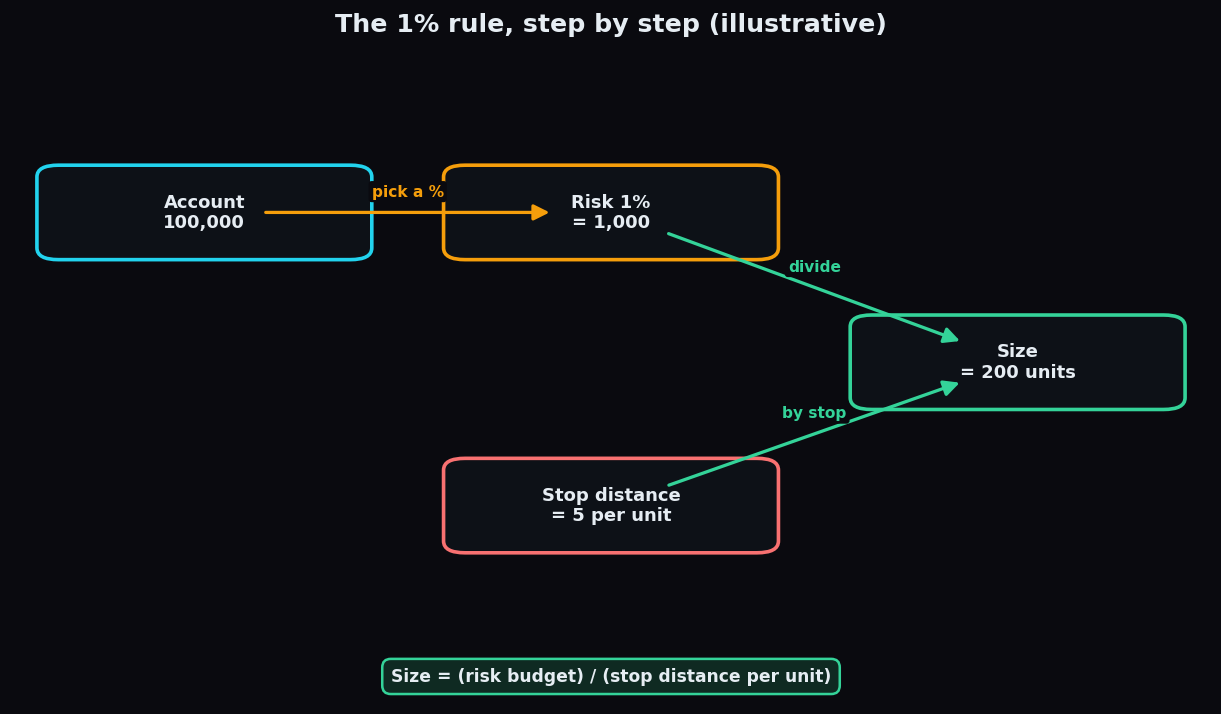
Position size is your risk budget divided by the risk per unit:
- Risk budget = account × the percent you allow (say 1%).
- Risk per unit = the distance from your entry to your exit level.
- Quantity = risk budget ÷ risk per unit.
Work it through with round numbers. Account of 1,00,000, risking 1% gives a budget of 1,000. Say your entry is 100 and your exit level is 95, so the distance — the risk per unit — is 5. Then quantity = 1,000 ÷ 5 = 200 units. If price falls from 100 to 95 across those 200 units, the loss is exactly 200 × 5 = 1,000, which is your planned 1%. The maths closes perfectly.
Why the exit distance changes everything
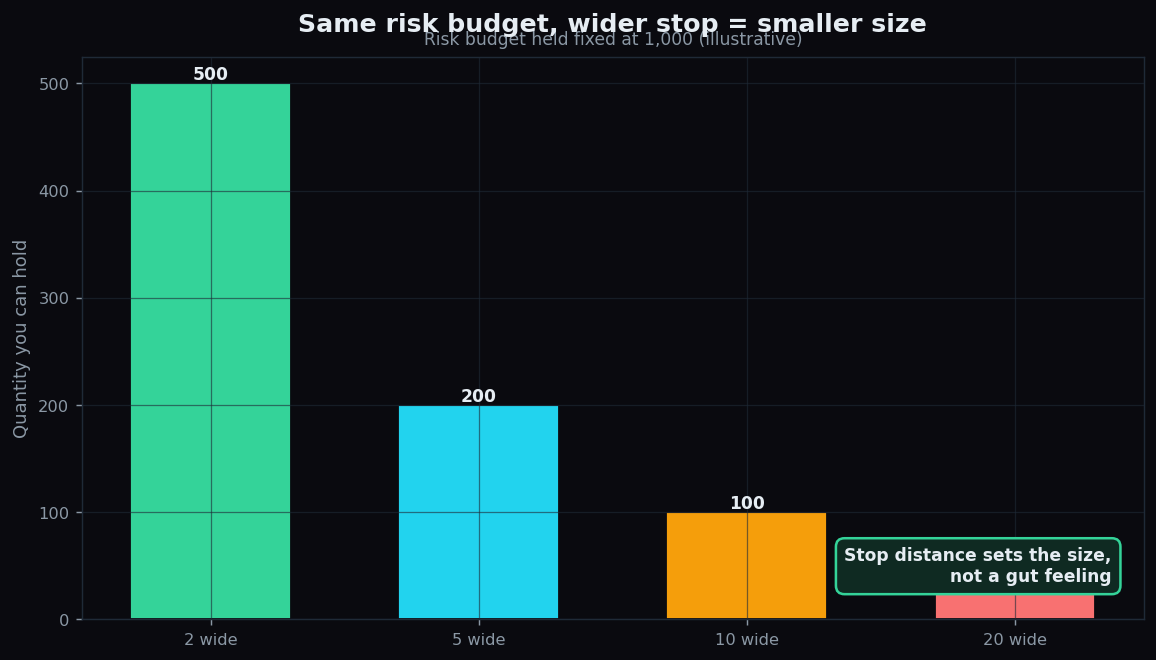
Keep the risk budget fixed at 1,000 and watch what happens as the exit distance changes. A tight exit lets you hold a large quantity; a wide exit forces a small one — because the same 1,000 has to stretch across a bigger move.
- Exit distance 2 → 1,000 ÷ 2 = 500 units.
- Exit distance 5 → 1,000 ÷ 5 = 200 units.
- Exit distance 10 → 1,000 ÷ 10 = 100 units.
- Exit distance 20 → 1,000 ÷ 20 = 50 units.
This is the part that feels backwards at first: a more volatile idea, which needs a wider exit to breathe, should usually be held in a smaller quantity, not a larger one. Sizing by risk automatically does this for you.
An everyday analogy
Think of your account as a water tank and each trade as a tap that could leak. The 1% rule caps how big any single leak can be. It does not stop leaks — losses are normal — it just guarantees no single one drains the tank. A trader with a full tank can keep playing and let a good strategy show its edge over many attempts. A trader whose tank is nearly empty has no more turns, no matter how good the next idea is. In markets, staying in the game is the whole game.
How people use it
In practice, sizing turns a vague plan into three concrete numbers before entering: where I get in, where I am wrong, and therefore how many units. Because the exit level and the quantity are linked, you cannot honestly size a position without first deciding where the idea fails. That forces the same discipline covered in our guide to reading trend context with moving averages — you define the map before you drive.
The honest catch
Position sizing controls risk; it does not create edge. A few caveats keep it honest:
- Gaps break the promise. Your 1% assumes you exit near your level. If price jumps overnight straight past it, the real loss can be larger. Sizing limits typical damage, not worst-case shocks.
- Correlation stacks risk. Five separate ideas each risking 1% can behave like one big 5% bet if they all move together (say, five bank stocks on a bad day for banks). The account-level risk can be bigger than it looks.
- It cannot fix a losing strategy. Perfect sizing on ideas with no edge just slows the bleeding. Sizing decides how long you survive; your strategy decides whether survival is worth it.
Discipline is easier when you can see whether an approach actually works before you commit money to it. TrueTrend keeps an honest, updated performance scoreboard so beginners can judge the method first — no sign-up wall on the numbers.
Key takeaways
- Position sizing means sizing a trade by the money at risk, not by how confident you feel.
- The 1% rule caps loss per idea so a losing streak is recoverable, not fatal.
- Quantity = risk budget ÷ distance to your exit level; a wider exit forces a smaller size.
- Volatile ideas usually deserve smaller sizes, and sizing by risk does this automatically.
- Sizing controls survival, but it cannot rescue a strategy with no edge, and gaps or correlation can exceed the plan.
See these concepts on live market data — free
Create a free TrueTrend account to watch daily support/resistance levels, market regime, and option-positioning charts on NIFTY, BankNifty and 12 more instruments. Every level we publish is scored on a public scoreboard — misses included. No card required.
Free forever tier · daily levels with published hit-rates across every instrument. Descriptive market structure, not investment advice.
Not ready for an account? Get the daily levels by email.
One short email each market day — the indices' call wall, put wall, gamma flip and max pain, and how the last session's levels scored. Free, no account, unsubscribe anytime.
Descriptive market structure, not investment advice. We never share your email.