The Risk-Reward Ratio Explained for Beginners
Every trade or investment carries two possibilities: it works, or it does not. The risk-reward ratio is simply a way to compare those two possibilities before you commit. It asks a plain question: for the amount I could lose if I am wrong, how much could I gain if I am right? This post explains what that ratio means, why it quietly decides whether a strategy can survive, and where it can mislead you. Everything here is for education, with round illustrative numbers — not a recommendation to trade anything.
What the risk-reward ratio actually is
The risk-reward ratio compares potential loss against potential gain on a single idea. Risk is how far price could move against you before you decide the idea is wrong. Reward is how far it could move in your favour before you would step aside. Divide the reward by the risk and you get the ratio.
Picture an entry at a price of 100. Suppose you decide that if price fell to 95 you would treat the idea as wrong — that is 5 points of risk. Suppose you also think price could reach 115 — that is 15 points of potential reward. Fifteen divided by five is three, so this idea has a reward-to-risk ratio of 3 : 1. For every 1 unit at stake, 3 units are on the table.
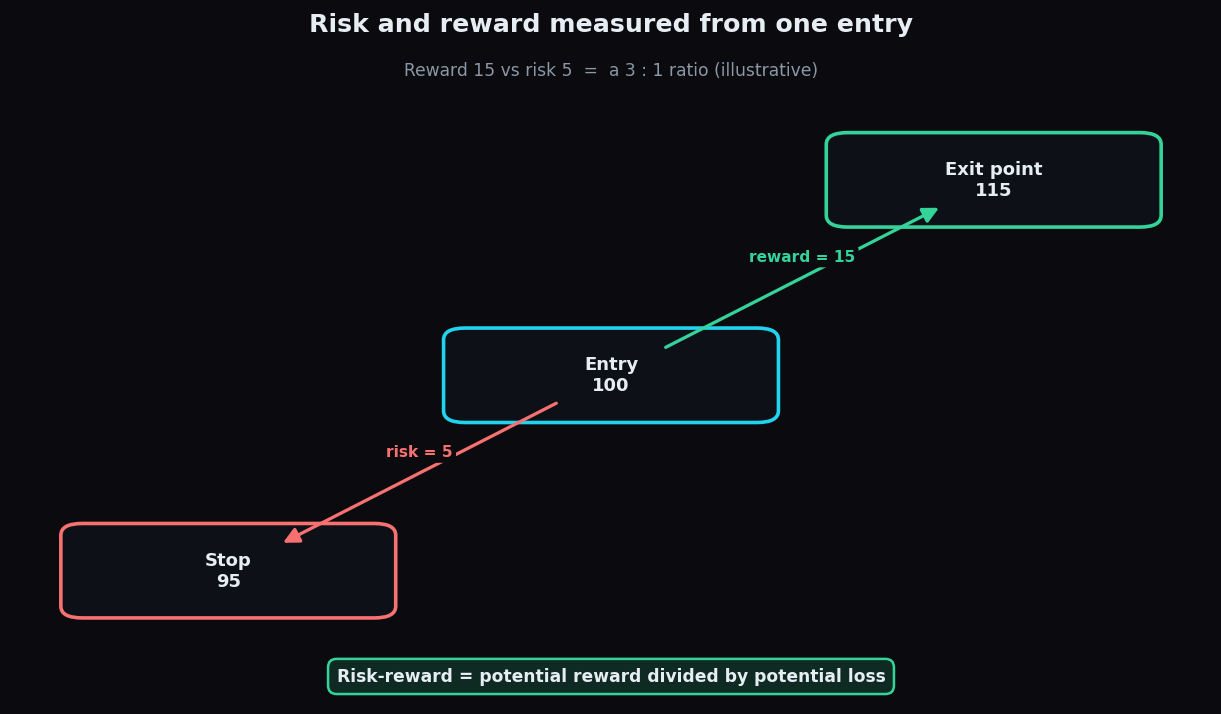
Notice that both numbers are measured from the same entry point. The ratio is not about the price of the stock or the size of your account. It is a shape: the distance down versus the distance up.
Why it matters more than your win-rate
Beginners obsess over being right. But being right often is worthless if the few times you are wrong wipe out all the small wins. The risk-reward ratio and your win-rate (the share of ideas that work) are two halves of the same coin. Together they decide whether a strategy makes or loses money over many repetitions.
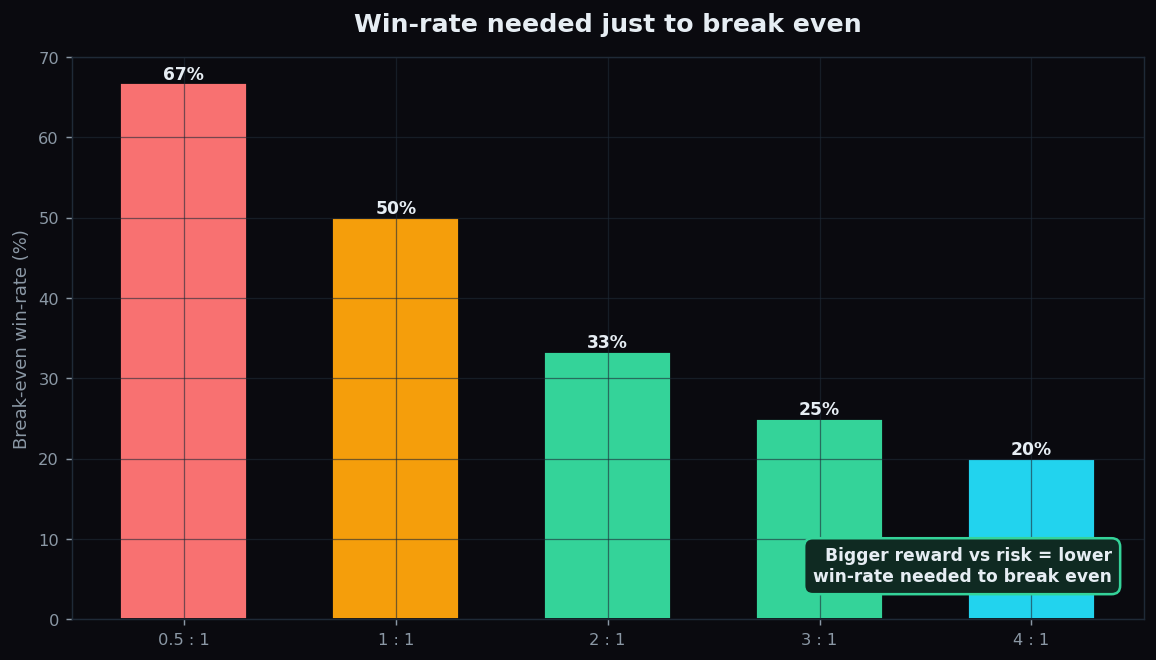
Here is the key idea: a wider reward relative to risk lowers the win-rate you need just to break even. The break-even win-rate is the loss size divided by the sum of loss and gain sizes. Run the numbers for a few ratios:
- At 1 : 1 (risk 5 to make 5), you need to be right more than 50% of the time.
- At 2 : 1 (risk 5 to make 10), you need only about 33%.
- At 3 : 1 (risk 5 to make 15), roughly 25% is enough to break even.
- At 0.5 : 1 (risk 10 to make 5), you must win about 67% of the time just to stay level.
Read that chart slowly. It explains why a trader who is right only one time in three can still come out ahead, while another who is right two times in three can still bleed money. The ratio changes the maths under everything.
A worked example with round numbers
Imagine ten identical illustrative ideas, each risking 1,000 to potentially make 3,000 — a clean 3 : 1 shape. Suppose only 4 of the 10 work out and 6 fail.
- 4 winners × 3,000 = +12,000
- 6 losers × 1,000 = −6,000
- Net across ten ideas = +6,000, despite being wrong most of the time.
Now flip the shape. Say each idea risks 3,000 to make 1,000 — a 1 : 3 shape — and you are right 6 times out of 10:
- 6 winners × 1,000 = +6,000
- 4 losers × 3,000 = −12,000
- Net = −6,000, despite being right most of the time.
Same person, same market, opposite outcome — purely because of the ratio. That is the whole point.
How people use it
Think of the ratio like a shopkeeper judging stock: you would not pay 90 for something you can only sell for 100, because one bad box ruins the month. Traders use the ratio the same way — as a filter. Many will simply pass on ideas whose reward is small relative to the risk, because the maths quietly works against them over time.
It also forces honesty. To even calculate the ratio, you must decide in advance where the idea is wrong and where you would be satisfied. That decision, made calmly before entering, is often more valuable than the number itself. If you want to go deeper on where that exit level comes from, our explainer on how moving averages define trend context shows one common way traders frame those levels.
The honest catch
A good ratio on paper is not a promise. Three things break it in the real world:
- The reward is a guess. You control your risk fairly well, but the reward is only an estimate. Markets rarely travel exactly to your imagined level. A dreamy 5 : 1 that never reaches its target is worse than a realistic 2 : 1 that does.
- Slippage and costs shave both ends. Real fills, brokerage and gaps can make your actual loss bigger and your actual gain smaller than the neat plan.
- A single idea proves nothing. The ratio only expresses itself across many repetitions. One trade is a coin toss; the maths shows up over dozens.
So treat the ratio as one lens, not a verdict. It tells you the terms of the bet, not the odds of winning it. You still need a realistic reward estimate and a win-rate you can actually achieve.
Want to see how a disciplined, rules-first view of the market holds up over hundreds of real sessions? TrueTrend publishes an honest, updated hit-rate scoreboard so you can judge the approach with your own eyes before you trust it.
Key takeaways
- The risk-reward ratio compares potential loss to potential gain, both measured from the same entry point.
- A wider reward-to-risk shape lowers the win-rate you need just to break even — 3 : 1 needs only about 25%.
- Win-rate and ratio work together; you can be wrong often and still profit, or right often and still lose.
- The reward side is only an estimate, so a great ratio on paper can quietly disappoint in practice.
- It is a filter and a discipline, not a guarantee — and it only matters across many repetitions.
See these concepts on live market data — free
Create a free TrueTrend account to watch daily support/resistance levels, market regime, and option-positioning charts on NIFTY, BankNifty and 12 more instruments. Every level we publish is scored on a public scoreboard — misses included. No card required.
Free forever tier · daily levels with published hit-rates across every instrument. Descriptive market structure, not investment advice.
Not ready for an account? Get the daily levels by email.
One short email each market day — the indices' call wall, put wall, gamma flip and max pain, and how the last session's levels scored. Free, no account, unsubscribe anytime.
Descriptive market structure, not investment advice. We never share your email.