RSI Explained: The Relative Strength Index
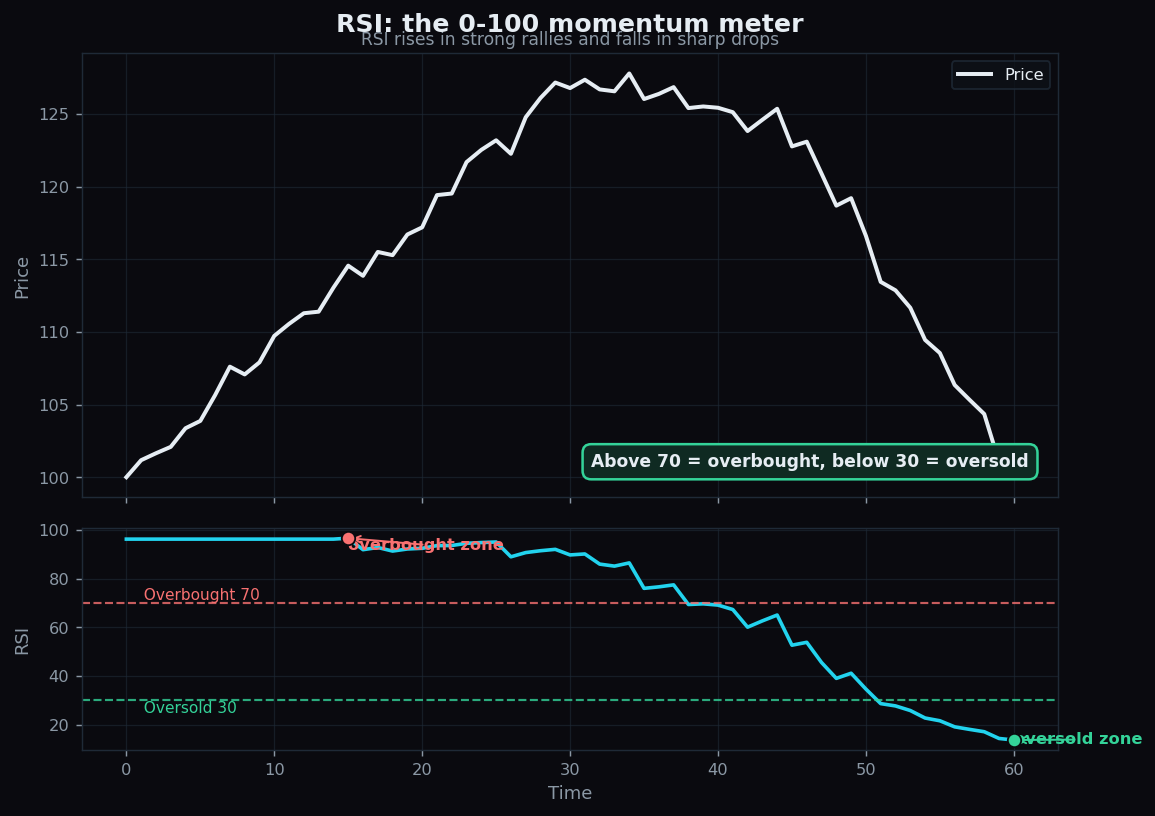
The Relative Strength Index, or RSI, is one of the most popular indicators on any trading screen — a single wiggly line that travels between 0 and 100 beneath the price. It tries to answer a simple question: has a move been so fast and one-sided that it might be stretched? This post explains what RSI measures, the famous 70 and 30 levels, the more subtle idea of divergence, and the lag that limits all of it.
This is education about what the indicator is and where it breaks down — not a recommendation to act on any reading.
What RSI actually measures
RSI is a momentum indicator. Momentum just means the speed and force of recent price moves — not the price level itself, but how energetically it has been changing. RSI looks back over a window (the default is 14 periods) and compares the size of the up-moves to the size of the down-moves. Then it squeezes that comparison onto a 0–100 scale.
- If recent gains dominate, RSI rises toward 100.
- If recent losses dominate, RSI falls toward 0.
- If gains and losses are balanced, RSI hovers near 50.
The everyday analogy: a car's speedometer. It does not tell you where you are, only how fast you are going right now. A speedometer pinned near its maximum tells you the pace is extreme and probably hard to sustain — but it does not tell you the car is about to stop.
Overbought and oversold: the 70 and 30 lines
Two horizontal lines get drawn on the RSI panel by convention:
- Above 70 — “overbought.” The recent rally has been strong and fast.
- Below 30 — “oversold.” The recent decline has been strong and fast.
Here is the crucial bit beginners miss: overbought does not mean “too high” and oversold does not mean “too low.” They describe the speed of the move, not a verdict on price. A strongly trending market can sit above 70 for a long time while it keeps climbing. The words are vivid but easy to over-read — they flag stretched momentum, nothing more.
A worked example with round numbers
Suppose over the last 14 days a stock had 10 up-days and 4 down-days, and the up-days were much bigger than the down-days. Loosely, the average gain might be around 3 points against an average loss of about 1 point. RSI converts that 3-to-1 ratio of strength into a high reading — comfortably above 70.
Now the market cools: a stretch of small down-days arrives. Even if price has barely fallen, the balance of recent moves shifts toward losses, and the RSI line slides back down through 70 and toward 50. Notice what changed — not necessarily the price level, but the momentum. That is the whole nature of RSI: it tracks the pace of the move, which can turn well before the price does.
Divergence: the more interesting signal
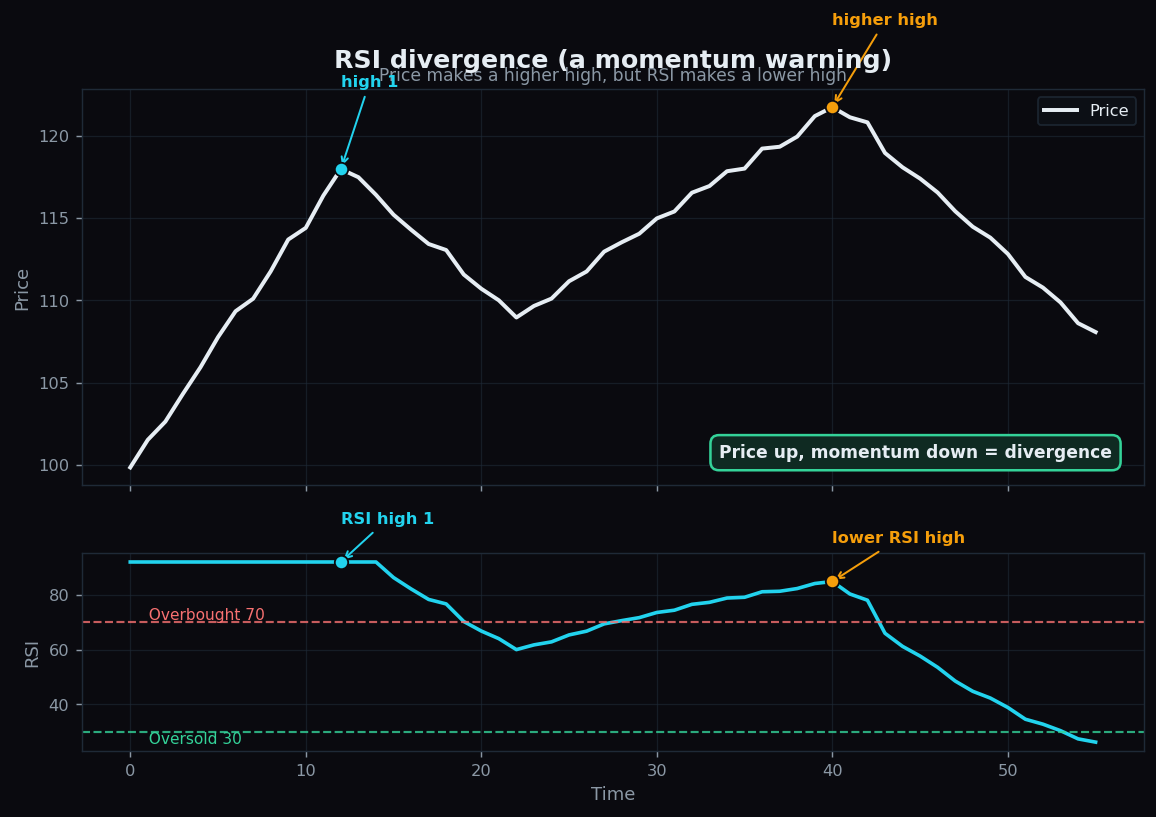
Beyond the 70/30 lines, many chart-readers find divergence the most useful thing RSI offers. Divergence is when price and RSI disagree:
- Bearish divergence: price makes a higher high, but RSI makes a lower high. Price climbed, yet the momentum behind the climb weakened.
- Bullish divergence: price makes a lower low, but RSI makes a higher low. Price fell further, yet the selling force eased.
The intuition: a runner setting a new distance record while visibly slowing down. The record (price) still improved, but the energy (momentum) is fading — a hint the trend may be tiring under the surface.
How RSI is used
Sensible use treats RSI as one descriptive layer, not a trigger:
- Context over thresholds. “RSI is 75” in a strong uptrend means something very different from 75 in a sideways market. The reading is interpreted, not obeyed.
- Divergence as a flag, not a verdict. Divergence can persist for a long time before anything happens — or resolve with price simply continuing. It raises a question; it does not answer one.
- Paired with trend tools. Many combine RSI with the trend backdrop from moving averages, so the momentum read sits inside a bigger picture.
- Settings change behaviour. A shorter look-back (say 7) makes RSI jumpier; a longer one (say 21) makes it smoother and slower. There is no “correct” setting.
The honest catch: lag and false signals
RSI is calculated from past prices, so it inherits the same limitation as every indicator built that way:
- It lags. RSI can only react after the moves that feed it have already happened. It is a description of what just occurred, not a preview.
- Overbought is not a top. In powerful trends, RSI parks above 70 (or below 30) for ages while price keeps going. Reading those levels as automatic reversals is the classic beginner mistake.
- Divergence misfires. Momentum can fade and then re-accelerate. Plenty of clean-looking divergences simply evaporate.
- Whipsaw in choppy markets. When price chops sideways, RSI darts across 30 and 70 repeatedly, generating signal after signal that goes nowhere.
So RSI is best understood as a momentum thermometer — genuinely informative about how stretched a move is, and genuinely silent about what happens next. Its value is in framing context, not in firing instructions.
An indicator is only as honest as the track record behind it. TrueTrend was built to keep that scrutiny in plain sight — our public scoreboard shows how signals really performed, stretched readings and all. Create a free account to explore RSI and other tools at your own pace.
Key takeaways
- RSI is a momentum indicator on a 0–100 scale, comparing the size of recent gains to recent losses over a look-back (default 14).
- Above 70 is “overbought” and below 30 is “oversold” — these flag fast moves, not “too high” or “too low.”
- Divergence — price and RSI disagreeing on highs or lows — hints that momentum is fading beneath the surface.
- RSI lags, can stay overbought or oversold through strong trends, and whipsaws in choppy markets.
- Treat it as a momentum thermometer read in context, never as a standalone signal.
See these concepts on live market data — free
Create a free TrueTrend account to watch daily support/resistance levels, market regime, and option-positioning charts on NIFTY, BankNifty and 12 more instruments. Every level we publish is scored on a public scoreboard — misses included. No card required.
Free forever tier · daily levels with published hit-rates across every instrument. Descriptive market structure, not investment advice.
Not ready for an account? Get the daily levels by email.
One short email each market day — the indices' call wall, put wall, gamma flip and max pain, and how the last session's levels scored. Free, no account, unsubscribe anytime.
Descriptive market structure, not investment advice. We never share your email.