The Stochastic Oscillator Explained Simply
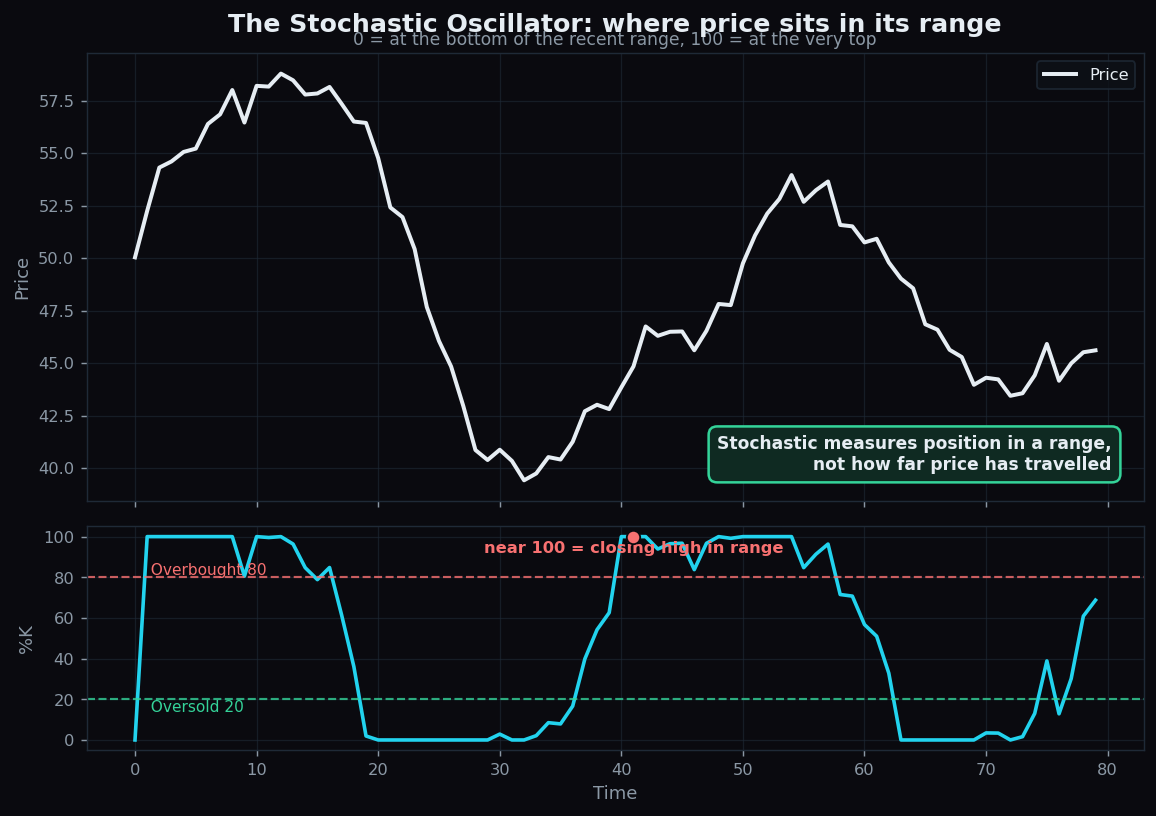
Most indicators ask “how far has price moved?” The Stochastic Oscillator asks a sharper question: where does today’s close sit inside the recent range? Developed by George Lane in the late 1950s, it is a momentum tool that lives in a tidy 0-to-100 box. This guide explains the %K and %D lines, what overbought and oversold really mean, and the limit that trips up almost every beginner.
Everything below uses simple, made-up numbers. It is an explanation of how the tool measures the market — not advice about what to do with it.
What the Stochastic Oscillator is
The Stochastic Oscillator is a momentum indicator — a measure of the speed and position of price rather than its level. Its core idea rests on a simple observation Lane made: in an up-move, closing prices tend to cluster near the top of the day’s range; in a down-move, closes tend to cluster near the bottom. So instead of tracking price itself, the oscillator tracks where the close falls within the high-to-low range of a recent window.
The result is squeezed onto a scale from 0 to 100. A reading near 100 means price just closed at the very top of its recent range; a reading near 0 means it closed at the very bottom; 50 means smack in the middle.
An analogy: the swimmer in the pool
Picture a swimming pool that keeps being refilled and drained, so its water level changes every day. The Stochastic does not care how deep the pool is — it only asks how high the swimmer’s head is between the current floor and surface. Head near the surface? Reading near 100. Head near the floor? Reading near 0. The pool (the range) keeps shifting, but the question stays the same: position within today’s water, not the absolute depth.
This is exactly why two stocks at wildly different prices can have the same Stochastic reading. The tool measures relative position in a range, not rupees.
The two lines: %K and %D
The Stochastic has two lines that work together.
- %K is the raw, faster line — the actual “where in the range” calculation for the latest period.
- %D is the slower line — simply a short moving average (usually 3 periods) of %K. It is %K’s smoothed shadow, lagging slightly and wobbling less.
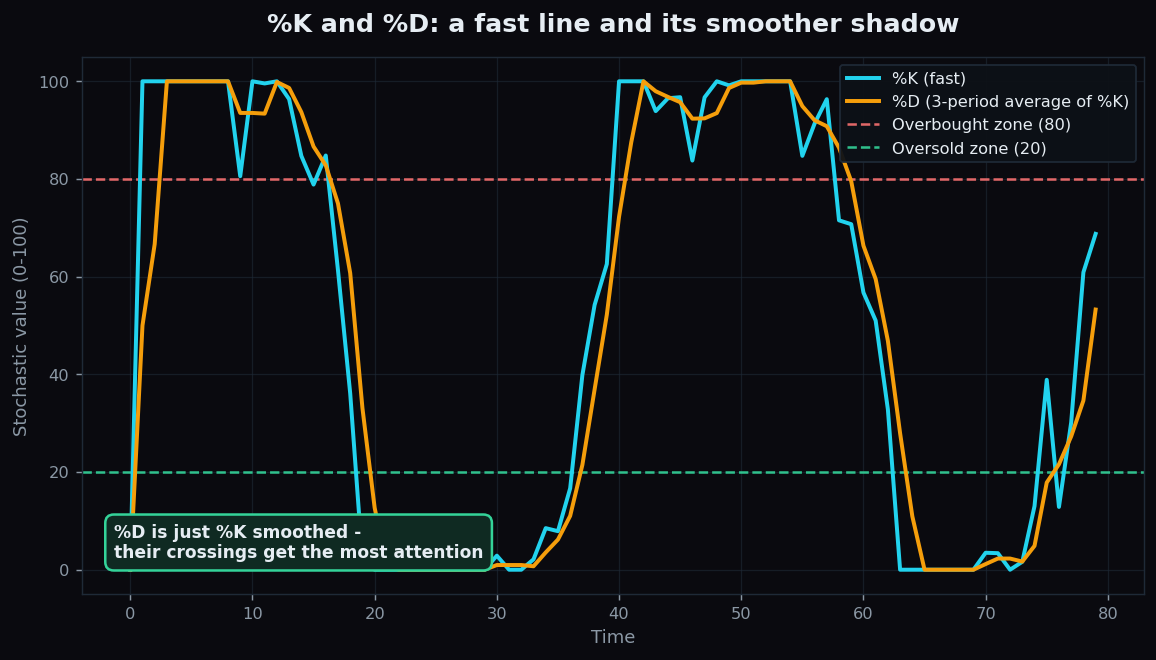
Because %D is just %K averaged, the two lines cross each other as momentum shifts. Chartists pay attention to those crossings and to where they happen — a crossing deep in the oversold zone is read differently from one in the middle of the range. But a crossing is a description of momentum changing, not an instruction.
The formula, with a worked example
The %K calculation over a chosen lookback (commonly 14 periods) is:
%K = (Current close − Lowest low) ÷ (Highest high − Lowest low) × 100
Let’s plug in round numbers. Over the last 14 periods, suppose:
- Highest high = ₹120
- Lowest low = ₹100
- Current close = ₹115
Then %K = (115 − 100) ÷ (120 − 100) × 100 = 15 ÷ 20 × 100 = 75. Price closed three-quarters of the way up its 14-period range. If the next close were ₹102, %K would drop to (102 − 100) ÷ 20 × 100 = 10 — near the bottom of the range. Same range, very different position.
Overbought and oversold — what they really mean
Two reference lines are usually drawn at 80 and 20. Above 80 is labelled overbought; below 20 is oversold. These words sound like verdicts, but they are just descriptions:
- Overbought (above 80) means price has been closing near the top of its recent range — momentum has been strong and upward.
- Oversold (below 20) means price has been closing near the bottom — momentum has been weak and downward.
Crucially, “overbought” does not mean “about to fall.” It means “strong.” That distinction is the heart of using this tool honestly.
The honest catch: strong trends pin it
Here is the failure mode that catches everyone. In a powerful trend, the Stochastic can jam against 100 (or 0) and stay there for a long time. Each new close keeps landing near the top of the range, so the reading stays “overbought” bar after bar while price keeps climbing. Anyone treating “overbought” as a turn signal gets run over repeatedly.
That is why the Stochastic is often described as a range tool. When a market is chopping sideways, its swings to 80 and 20 line up reasonably well with the edges of the range. When a market is trending hard, those same readings simply confirm the strength. The indicator did not break — the regime changed under it.
Other limits worth remembering:
- It lags. Every input is a past price; the oscillator reports what already happened.
- Whipsaws. The fast %K line can flick across the 80/20 lines many times in choppy, low-conviction conditions, producing noise.
- Settings change everything. 14 periods, 80/20, a 3-period %D — all conventions. Shift them and the picture shifts. There is nothing magic about the defaults.
Read as a gauge of where price sits and how momentum is leaning, the Stochastic adds real context. Read as a press-this-button machine, it disappoints — because measuring position in a range was never the same as predicting the next move. Momentum-style readings like this pair naturally with trend tools such as moving averages, which describe direction rather than position.
Curious how momentum and range readings actually hold up over many sessions instead of in a tidy textbook chart? TrueTrend tracks its market readings out in the open and scores them honestly over time — browse the TrueTrend scoreboard or create a free account to follow along.
Key takeaways
- The Stochastic Oscillator measures where the latest close sits inside the recent high-to-low range, on a 0-to-100 scale.
- %K is the raw fast line; %D is a short moving average of %K — its smoother shadow. Their crossings describe momentum shifts.
- Lines at 80 (overbought) and 20 (oversold) describe whether closes have been hugging the top or bottom of the range — they mean “strong” or “weak,” not “about to reverse.”
- In strong trends the reading can pin near 100 or 0 for a long time; it works best as a context tool in ranging markets.
- It lags, can whipsaw, and depends entirely on its settings — treat it as a momentum gauge, not a prediction.
See these concepts on live market data — free
Create a free TrueTrend account to watch daily support/resistance levels, market regime, and option-positioning charts on NIFTY, BankNifty and 12 more instruments. Every level we publish is scored on a public scoreboard — misses included. No card required.
Free forever tier · daily levels with published hit-rates across every instrument. Descriptive market structure, not investment advice.
Not ready for an account? Get the daily levels by email.
One short email each market day — the indices' call wall, put wall, gamma flip and max pain, and how the last session's levels scored. Free, no account, unsubscribe anytime.
Descriptive market structure, not investment advice. We never share your email.