The Supertrend Indicator Explained for Beginners
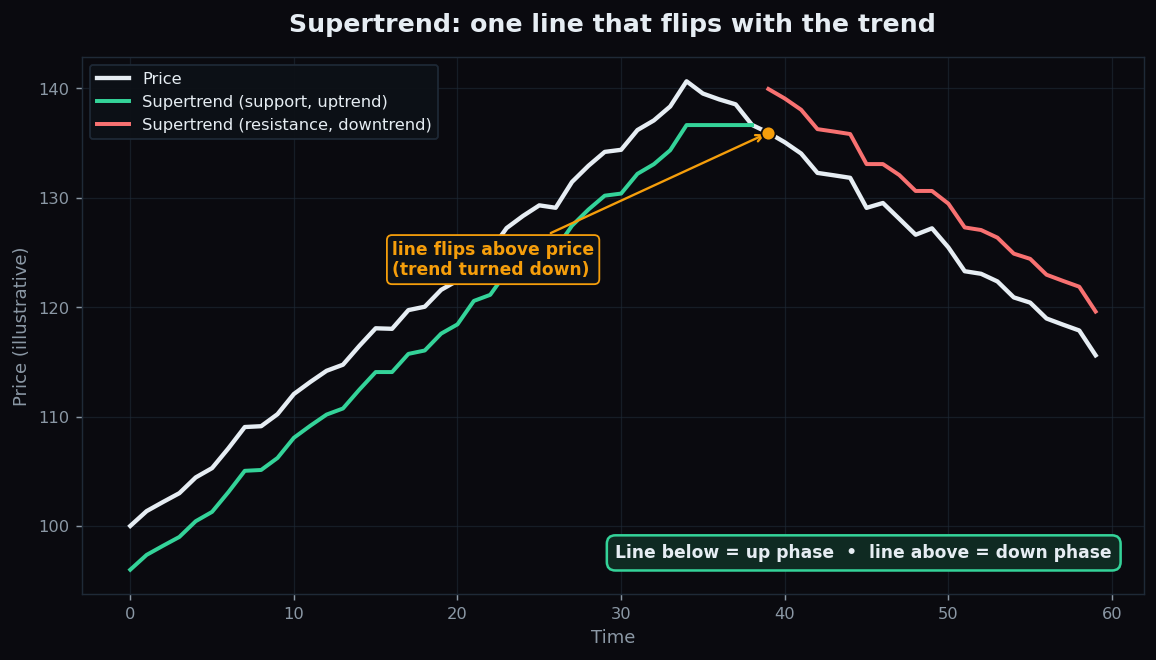
If you have ever wished a chart could simply tell you — in one glance — whether a stock or index is trending up or down, the Supertrend indicator was built for exactly that wish. It draws a single coloured line that sits below price in an up phase and above price in a down phase, flipping sides only when the trend appears to change. It is one of the most popular trend tools on Indian trading screens precisely because it is so easy to read.
What the Supertrend actually is
Supertrend is a trend-following indicator: a calculation that tries to stay on the side of the prevailing move rather than predict turns in advance. It is built on top of a volatility measure called the Average True Range, or ATR. ATR simply measures how much an instrument typically moves in a given period — a calm, slow stock has a small ATR, while a fast, jumpy one has a large ATR.
The indicator takes the midpoint of each candle and adds a band above and below it, where the band width is the ATR multiplied by a setting (commonly 3). It then keeps only one of those bands visible at a time:
- When price is rising, the lower band shows as support beneath the candles.
- When price falls and closes through that band, the line flips to the upper band and now sits above price as resistance.
The two common settings you will see are the ATR period (how many candles of volatility to average, often 10) and the multiplier (how far from price to place the band, often 3). A larger multiplier makes the line looser and slower to flip; a smaller one makes it tighter and quicker.
An everyday analogy
Think of Supertrend as a guardrail that follows a winding mountain road. While you drive uphill, the rail runs along the lower edge of the road, quietly tracking you from below. Only when the road clearly turns and you start heading downhill does the crew move the rail to the other side. The rail never tells you where the road goes next — it just marks which side of you the danger currently sits. Supertrend works the same way: it follows, it does not forecast.
Why it matters
The appeal is clarity. A new chart reader can struggle to decide whether a market is “trending” at all. Supertrend turns that fuzzy judgement into a single visible state: line below or line above. Because the band is built from ATR, it also adapts to volatility automatically. On a quiet day the line hugs price closely; on a wild day it sits far away, so normal noise does not cause a flip. That is a genuinely useful property — a fixed-distance stop cannot do this.
Supertrend belongs to the same family as moving averages: both smooth out noise to reveal direction. The difference is that Supertrend is explicitly designed to flip and act as a moving line in the sand, while a moving average is just an average.
A worked example with round numbers
Suppose an index is trading at 20,000. The ATR over the chosen period works out to 50 points, and the multiplier is 3, so the band width is 50 × 3 = 150 points.
- The lower band sits at 20,000 − 150 = 19,850. While the index stays above this, Supertrend shows green support at 19,850.
- The index drifts up to 20,300. The band trails up with it — say the support line ratchets to 20,050. Notice it only moves up, never down, during an uptrend.
- Now a sharp fall arrives and the index closes at 20,000, below the trailing 20,050 line. Supertrend flips: it switches to the upper band and now sits above price as resistance, signalling that the up phase, by this indicator’s rules, has ended.
This is purely an illustration of the mechanics with made-up numbers, not a recommendation to act at any level. The point is to see how the line trails one way, then snaps to the other side on a decisive close.
The honest catch
Supertrend has one well-known weakness, and it is important: it is terrible in a sideways market. When price drifts in a flat range with no real trend, the candles keep poking through the band in both directions, and the line flips back and forth repeatedly. Each flip looks like a fresh signal, but most of them lead nowhere. Traders call this whipsaw.
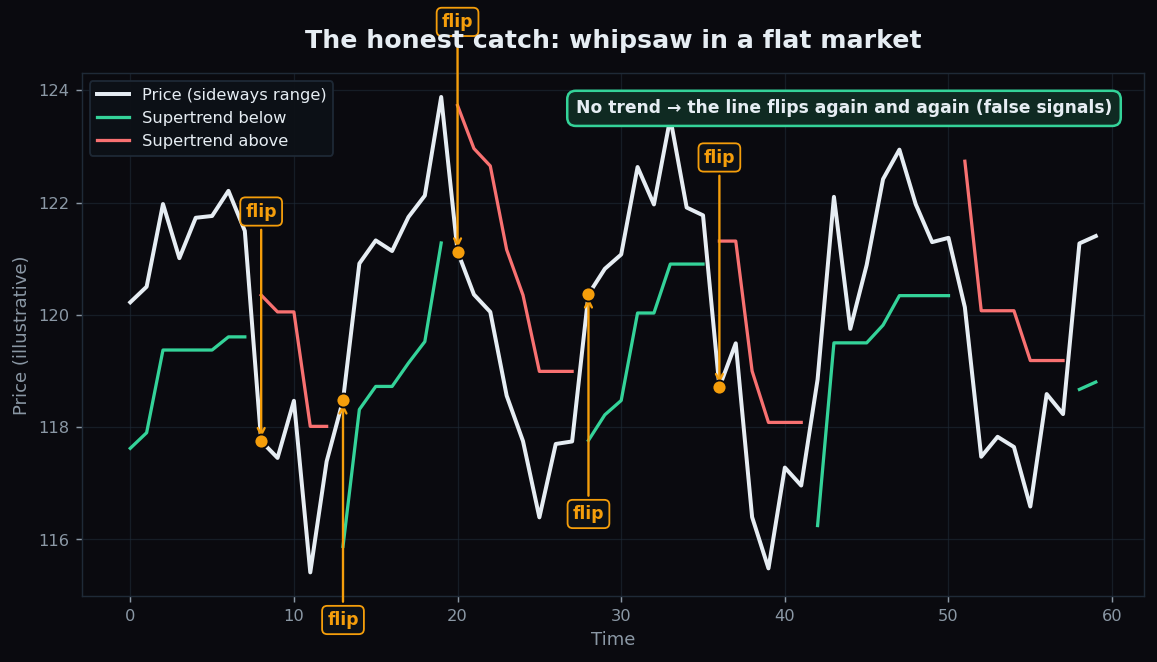
The picture above shows the problem: in a range, almost every flip is a false alarm. The same feature that makes Supertrend so clean in a strong trend — its willingness to flip — becomes a liability when there is no trend to follow. A second, smaller catch is lag: because the line waits for a decisive close to flip, it always confirms a turn after the fact, never before. You give up the first chunk of every move in exchange for clarity.
This is why experienced chart readers rarely use Supertrend alone. They often pair it with a separate gauge of whether a trend even exists — such as ADX — so they can ignore the flips during flat, choppy phases and pay attention only when the market is genuinely moving.
How people actually use it
In practice, Supertrend is treated as a context tool and a trailing reference, not a magic button. Common uses include reading the broad direction at a glance, using the line as a visual trailing stop level that tightens as a move matures, and combining it with volume or a trend-strength filter to weed out the whipsaw signals. The settings matter too: shorter, tighter settings suit fast intraday charts but flip more; longer, looser settings suit position trading but lag more.
Curious how trend tools like Supertrend behave across real, recent sessions instead of textbook diagrams? TrueTrend publishes transparent, plain-language market analytics so you can study structure for yourself. See the public TrueTrend scoreboard or create a free account to explore.
Key takeaways
- Supertrend is a trend-following line built on the ATR volatility measure; it sits below price in up phases and above in down phases.
- It adapts to volatility automatically — the band widens when the market is wild and tightens when it is calm.
- The two settings are the ATR period and the multiplier; bigger multiplier = looser, slower line.
- Its great strength is clarity in a real trend; its great weakness is whipsaw in a flat, sideways market.
- It lags by design — it confirms turns after a decisive close, never before — so many readers pair it with a trend-strength filter.
- Everything above is educational and uses illustrative numbers only; it is not advice to trade.
See these concepts on live market data — free
Create a free TrueTrend account to watch daily support/resistance levels, market regime, and option-positioning charts on NIFTY, BankNifty and 12 more instruments. Every level we publish is scored on a public scoreboard — misses included. No card required.
Free forever tier · daily levels with published hit-rates across every instrument. Descriptive market structure, not investment advice.
Not ready for an account? Get the daily levels by email.
One short email each market day — the indices' call wall, put wall, gamma flip and max pain, and how the last session's levels scored. Free, no account, unsubscribe anytime.
Descriptive market structure, not investment advice. We never share your email.