VWAP Explained: Volume Weighted Average Price
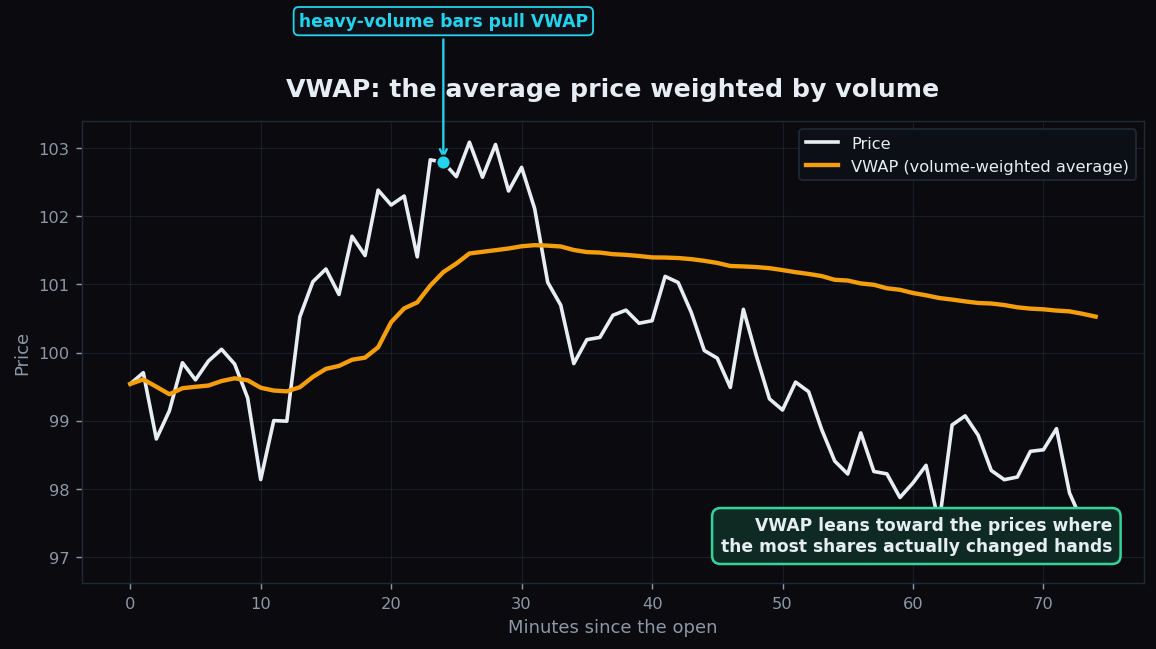
Ask a fund manager who quietly moved millions of rupees of shares today how they judged their fills, and you will often hear one word: VWAP. Short for Volume Weighted Average Price, it is the benchmark that big institutions live by — and a fair-value line that intraday traders watch all day long. This guide explains what VWAP is, how it is calculated, who actually uses it, and where it stops being meaningful.
All numbers below are simple and made-up, used only to teach the idea. This is an explanation of a benchmark, not advice about what to do with it.
What VWAP is
VWAP is the average price of a stock over a period, weighted by how much volume traded at each price. The key word is weighted. A normal average treats every price equally. VWAP does not: prices where lots of shares changed hands count for more than prices where only a handful traded.
Here is the intuition. Imagine a class sits a test. A plain average of scores treats every student equally. Now imagine some students answered 50 questions and others answered just 2. A weighted average gives the busy students more pull, because they did more of the work. VWAP does the same with trades: the prices that did the most business — the heaviest volume — pull the line toward them.
VWAP almost always resets at the start of each trading day. It begins fresh at the open and accumulates through the session, so it is fundamentally an intraday tool — a running, volume-aware sense of the day’s “fair” price.
How it is calculated — a worked example
The formula is just a weighted average:
VWAP = (sum of price × volume) ÷ (sum of volume), accumulated from the open.
Let’s do it with three tidy trades:
- 100 shares trade at ₹100 → price × volume = 10,000
- 300 shares trade at ₹102 → price × volume = 30,600
- 100 shares trade at ₹104 → price × volume = 10,400
Add the price × volume column: 10,000 + 30,600 + 10,400 = 51,000. Add the volume: 100 + 300 + 100 = 500 shares. So VWAP = 51,000 ÷ 500 = ₹102.
Notice the pull. A simple average of the three prices (100, 102, 104) would be ₹102 as well here — but that is because the heaviest trade was at ₹102. If instead the 300-share trade had happened at ₹100, VWAP would drop toward ₹100.80, dragged down by the big block, even though the highest price touched was still ₹104. Volume decides the weighting.
Why VWAP matters and who watches it
VWAP earns its importance from one group above all: large institutions — mutual funds, pension funds, big desks — that need to buy or sell huge quantities without moving the price against themselves. They are measured on execution quality, and the standard yardstick is VWAP:
- If a fund buys a large position at an average price below the day’s VWAP, it paid less than the volume-weighted average — a good fill.
- If it sells a block at an average price above VWAP, it received more than the average — again, a good fill.
Because so much real money is benchmarked to VWAP, it becomes a kind of self-reinforcing fair-value line. Intraday traders watch it for context too. A common reading is that when price trades above VWAP, buyers are broadly in control for the day; when price is below VWAP, sellers have the upper hand. Many treat VWAP as an intraday line that separates “expensive relative to today’s average” from “cheap relative to today’s average.”
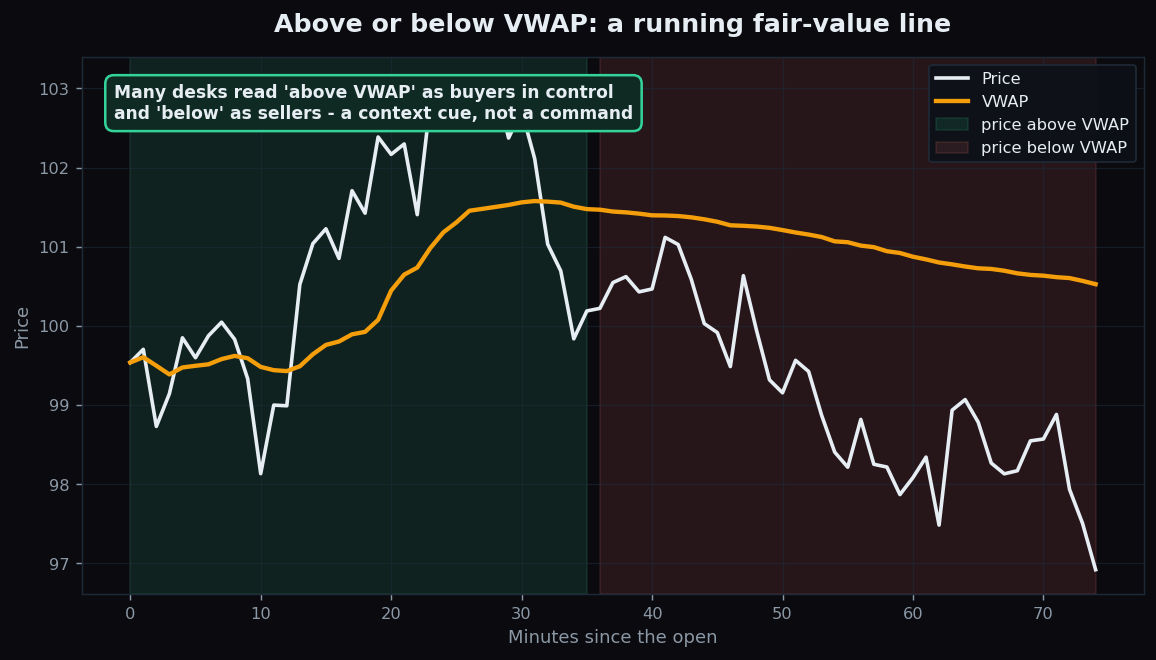
Importantly, this is context, not a command. “Above VWAP” describes where price sits relative to the day’s weighted average — it does not tell anyone what to do next.
VWAP versus a moving average
People sometimes confuse VWAP with a moving average, but they differ in two big ways. First, a moving average usually weights only by time (or recency); VWAP weights by volume, so it reflects where business actually happened. Second, a typical moving average rolls continuously across days, while standard VWAP resets every morning. That daily reset is exactly why VWAP is an intraday benchmark and a moving average is often a multi-day trend tool.
The honest catch: the limits of VWAP
VWAP is precise, but narrow. Respect its boundaries:
- It is mostly an intraday tool. Because it resets daily, standard VWAP says little about the multi-week trend. It answers “where is fair value today?”, not “where is this stock heading this month?”
- It is a lagging, cumulative average. As the day goes on, VWAP gathers more and more data, so it gets “heavier” and slower to move. By late afternoon a single trade barely budges it — it can lag a fast reversal badly.
- It describes, it does not predict. Price being above or below VWAP is a snapshot of the current balance, not a forecast. Price crosses VWAP many times on a choppy day.
- Low-volume names are noisy. In thinly traded stocks, a few large trades can yank VWAP around, making it less reliable as a “fair” reference.
Used for what it is — a volume-aware fair-value benchmark for the trading day — VWAP is genuinely powerful, which is why the largest players in the market grade themselves against it. Used as a crystal ball for tomorrow, it has nothing to say, because measuring today’s weighted average was never the same as predicting the future.
Want to see how intraday context like VWAP plays out across real sessions, with the results tracked openly instead of cherry-picked? TrueTrend keeps a transparent, honestly-scored record of its market readings over time — explore the TrueTrend scoreboard or create a free account to follow along.
Key takeaways
- VWAP (Volume Weighted Average Price) is the day’s average price weighted by volume — prices with heavier trading count for more.
- It is calculated as (sum of price × volume) ÷ (sum of volume), accumulated from the open, and it resets each morning.
- Large institutions use VWAP to judge execution: buying below VWAP or selling above it counts as a good fill, which makes it a widely-watched fair-value line.
- Price above VWAP is often read as buyers in control, below VWAP as sellers — useful context, not an instruction.
- VWAP is mostly intraday, gets slower and heavier through the day, only describes the current balance, and is noisy in thinly traded stocks.
See these concepts on live market data — free
Create a free TrueTrend account to watch daily support/resistance levels, market regime, and option-positioning charts on NIFTY, BankNifty and 12 more instruments. Every level we publish is scored on a public scoreboard — misses included. No card required.
Free forever tier · daily levels with published hit-rates across every instrument. Descriptive market structure, not investment advice.
Not ready for an account? Get the daily levels by email.
One short email each market day — the indices' call wall, put wall, gamma flip and max pain, and how the last session's levels scored. Free, no account, unsubscribe anytime.
Descriptive market structure, not investment advice. We never share your email.