Trend Lines Explained: Drawing and Using Them
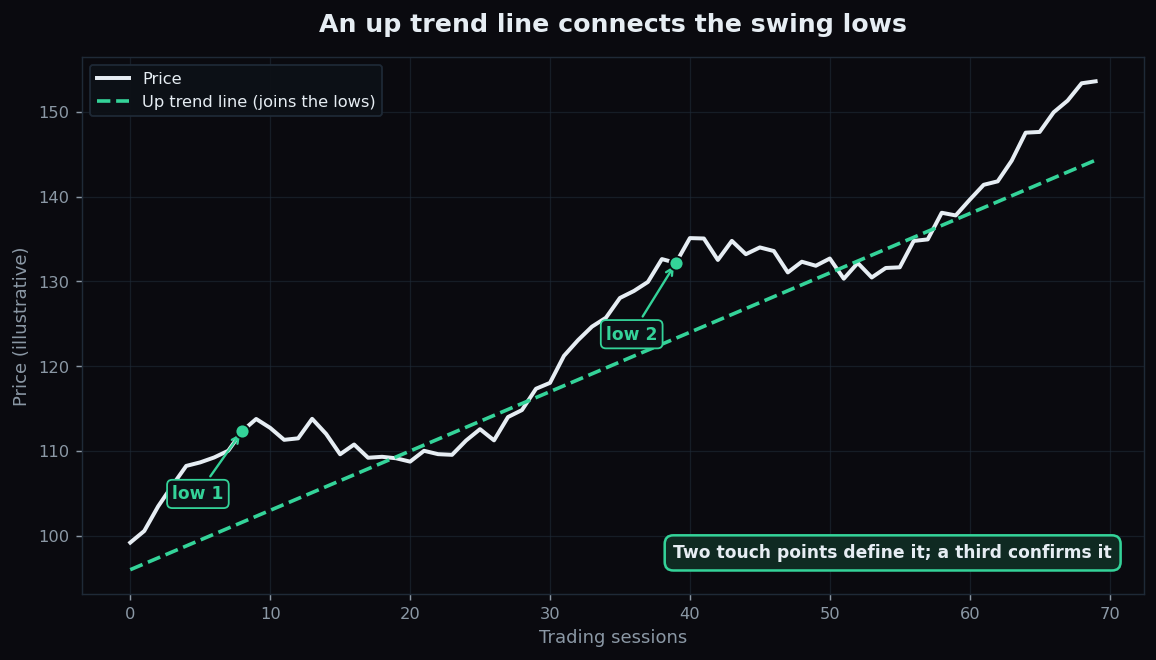
A trend line is the simplest drawing in all of chart reading: a single straight line laid along a price chart to show the direction price has been travelling. It costs nothing but a ruler and two dots, yet it captures something real — the slope and discipline of a move. This guide shows how trend lines are drawn, what channels add, and what a "break" means.
What a trend line is
Before drawing anything, two terms. A swing high is a local peak — a point where price stopped rising and turned down. A swing low is a local trough — where price stopped falling and turned up. A trend line connects a series of these:
- An up trend line is drawn along the swing lows, sloping upward. It traces the rising floor under an advance.
- A down trend line is drawn along the swing highs, sloping downward. It traces the falling ceiling over a decline.
The everyday analogy: imagine a marble rolling up a gently tilted ramp, bouncing along the surface as it climbs. The ramp is the trend line. As long as the marble keeps touching and rising along it, the climb is intact. When it crashes through the ramp, something has changed.
How to draw one
The rule is refreshingly strict, which is what keeps it honest:
- You need at least two touch points. Two swing lows (for an up trend line) define the line. Connect them and extend the line forward.
- A third touch confirms it. When price returns to the line a third time and respects it, the line has earned more credibility.
- Connect the extremes, not the bodies. On a candlestick chart, most people draw to the wicks — the actual highs and lows price reached.
- The gentler the slope, the more durable. A near-vertical line is usually too steep to last.
Two points make a line; a third makes it interesting. That is the whole discipline.
A worked example with round numbers
Here is an illustrative example — round numbers to teach the idea, not a recommendation. Suppose a stock makes a swing low at ₹100, climbs, dips to a higher swing low at ₹110, climbs again, then later dips to ₹120. Connect 100 and 110 and extend the line: it predicts the next "floor" should sit near 120 — and price touching 120 and bouncing is the third touch that confirms the line. Notice the lows are rising: 100, then 110, then 120. That rising floor is exactly what an up trend line is meant to capture.
Channels: two lines instead of one
Often price does not just respect one line — it travels inside a channel, a pair of roughly parallel trend lines. The lower line acts like support, the upper line like resistance, and price oscillates between them as it trends. A channel is useful because it frames the whole move: you can see both the rising floor and the rising ceiling at once.
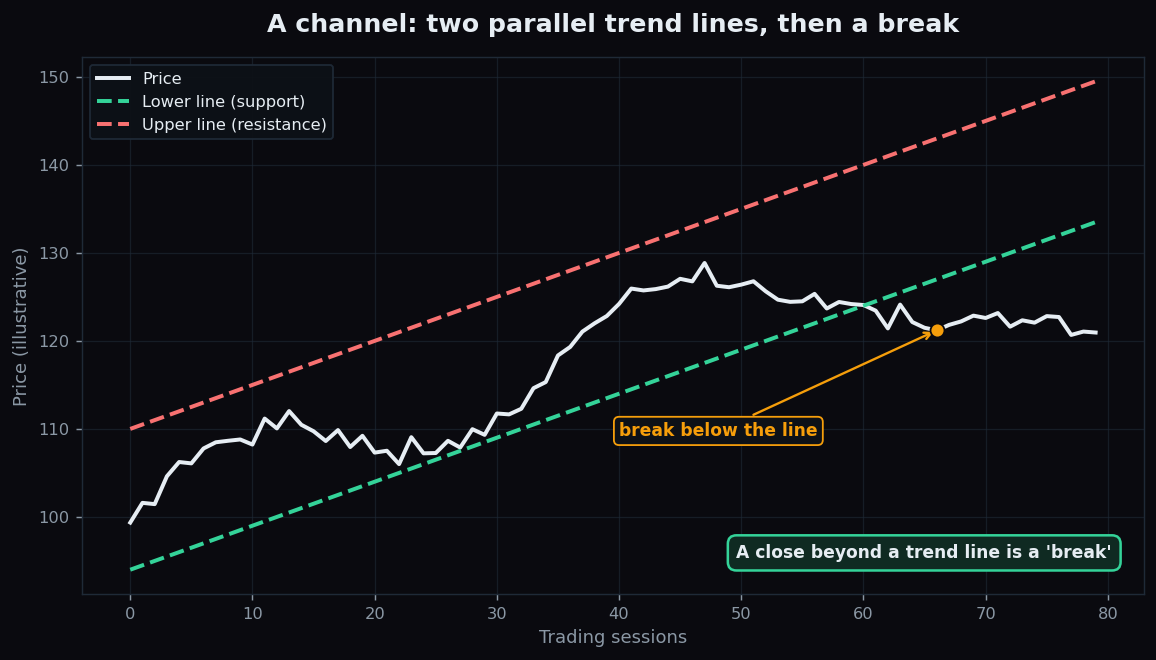
To sketch one, draw the trend line first (say, along the lows), then draw a parallel line touching the swing highs. The cleaner price bounces between the two, the more "respected" the channel is said to be.
Breaks: when the line gives way
A trend line is most informative at the moment it fails. A break is when price closes clearly on the wrong side of the line — below an up trend line, or above a down trend line. A break does not promise a reversal, but it says the rhythm that held for weeks has been interrupted, which is genuine information about a change in behaviour.
Chart readers usually look for confirmation rather than reacting to a single poke through:
- A closing price beyond the line carries more weight than a brief intraday spike.
- A break on heavier volume suggests more participants are behind it.
- A small cushion — price pushing a touch beyond the line — helps filter out meaningless wicks.
You can read more about how slow-moving averages provide a similar "is the trend intact?" read in our moving averages guide.
The honest catch
Trend lines are powerful precisely because they are simple — but that simplicity hides traps:
- They are subjective. Two people can connect different lows and draw two different lines on the same chart.
- They are fitted to the past. A line that looks perfect across old data can stop working the moment you extend it forward.
- False breaks are common. Price can dip below the line, scare everyone, then climb right back inside.
- Re-drawing is tempting. When a line breaks, it is easy to "adjust" it to keep being right. That is fooling yourself, not analysing.
Treated honestly, a trend line is a clean way to describe the direction and discipline of a move — not a device that predicts the next tick.
Want to see how often well-drawn levels and trends actually hold, with the failures shown too? TrueTrend keeps an open, no-spin analytics scoreboard so you can judge the track record yourself.
Key takeaways
- A trend line connects swing lows (up trend) or swing highs (down trend) to show a move's direction and slope.
- It needs two touch points to draw and a third to confirm; gentler slopes tend to last longer.
- A channel uses two parallel lines to frame both the floor and ceiling of a trending move.
- A break — a clear close beyond the line — signals the old rhythm was interrupted, ideally confirmed by volume.
- Trend lines are subjective and fitted to the past; false breaks happen and re-drawing to stay "right" is self-deception.
See these concepts on live market data — free
Create a free TrueTrend account to watch daily support/resistance levels, market regime, and option-positioning charts on NIFTY, BankNifty and 12 more instruments. Every level we publish is scored on a public scoreboard — misses included. No card required.
Free forever tier · daily levels with published hit-rates across every instrument. Descriptive market structure, not investment advice.
Not ready for an account? Get the daily levels by email.
One short email each market day — the indices' call wall, put wall, gamma flip and max pain, and how the last session's levels scored. Free, no account, unsubscribe anytime.
Descriptive market structure, not investment advice. We never share your email.