What Is Liquidity in the Stock Market? Depth and Spread
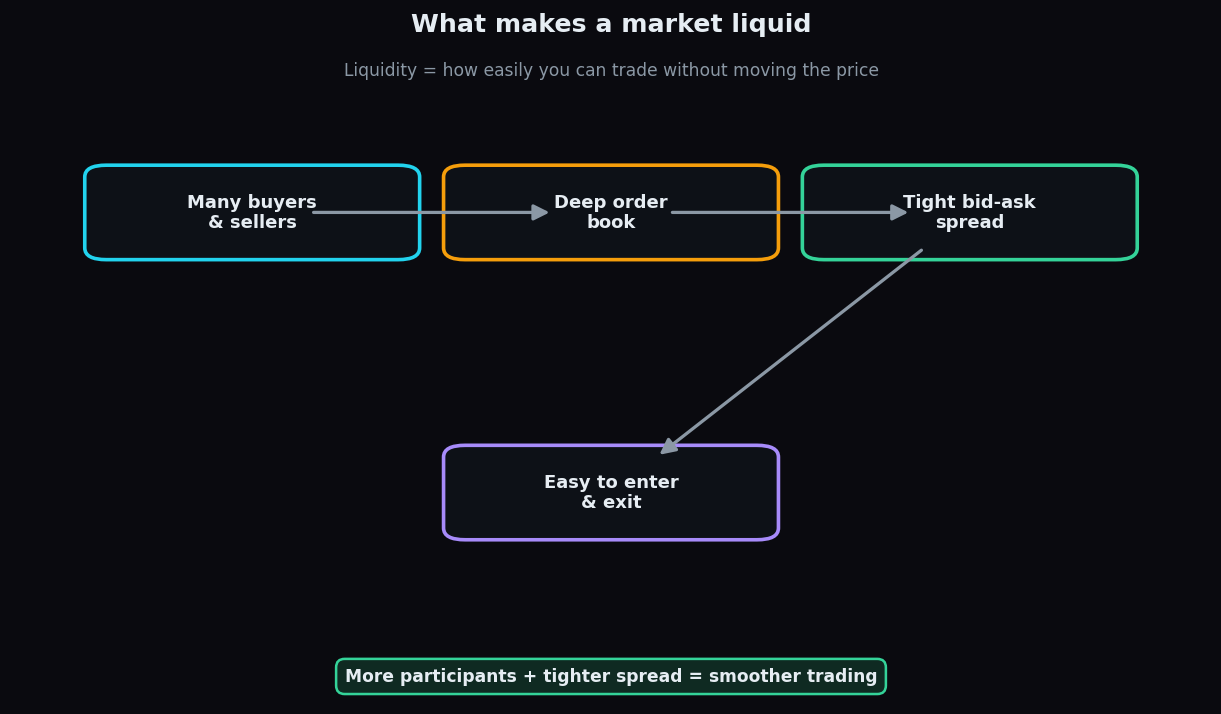
Liquidity is one of those words that sounds technical but describes something very simple: how easily you can buy or sell something without shoving its price around. A market with high liquidity feels smooth and frictionless; a market with low liquidity feels sticky and expensive. This post explains what liquidity is, the two ideas that measure it — depth and the spread — and why it quietly matters to everyone.
What liquidity means
In markets, liquidity is the ease of converting an asset into cash (or cash into an asset) quickly, at a fair price, without causing a big price move. An asset is “liquid” if there are plenty of willing buyers and sellers ready at any moment.
A simple analogy: think of selling something. A popular item at a busy bazaar — say a common phone model — sells in minutes at roughly the going rate; that is high liquidity. A rare antique might be valuable, but finding a buyer takes weeks and you may have to drop the price to close the deal; that is low liquidity. Same idea in markets: liquid = easy and quick to trade near the fair price; illiquid = slow and costly.
The two things that measure it: depth and spread
Liquidity is mostly captured by two related ideas.
1. The bid-ask spread
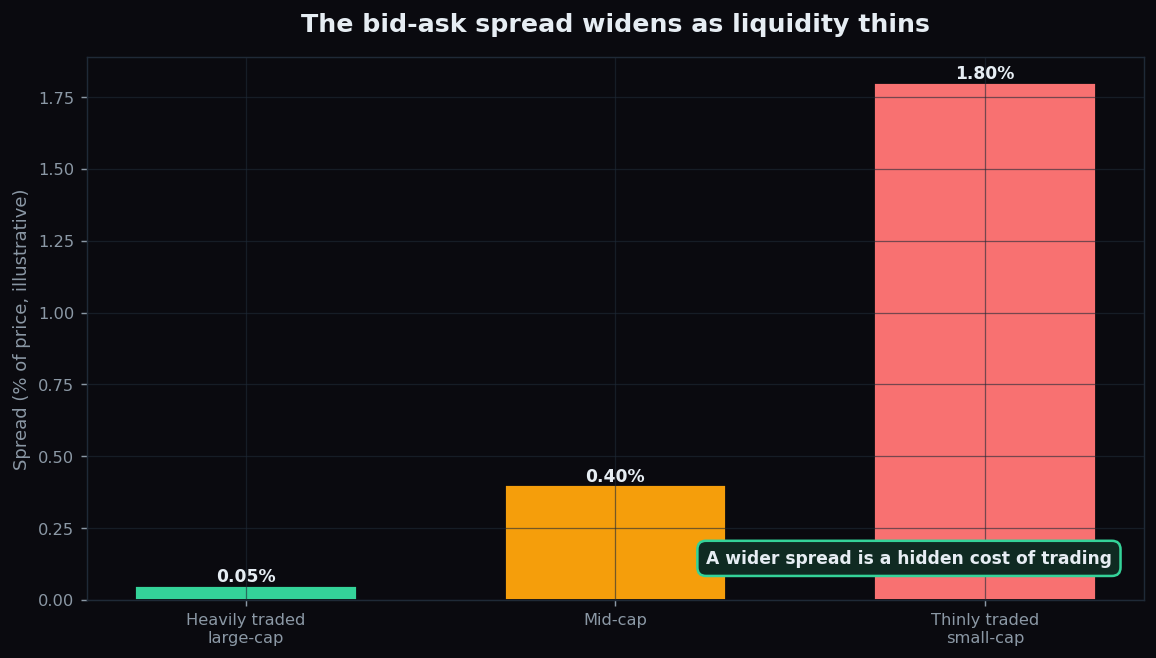
At any instant there is a bid (the highest price a buyer will pay) and an ask or offer (the lowest price a seller will accept). The gap between them is the spread. In a liquid market the spread is tiny because many participants are competing; in an illiquid one it is wide. The spread is effectively a hidden cost: you tend to buy at the higher ask and sell at the lower bid, so a wide spread eats into you on the way in and out.
2. Market depth
Depth is how many shares are waiting to trade at, and near, the current price — the stack of orders in the order book. A deep market can absorb a large order with barely a wobble. A shallow market gets pushed around because there are not enough orders to soak up the trade, so a single big order walks the price up or down.
A worked example with round numbers
Imagine you want to buy 1,000 shares of two companies (all numbers invented for teaching).
Liquid Co trades with a bid of ₹199.95 and an ask of ₹200.05 — a spread of just 10 paise, and thousands of shares queued at each price. You buy your 1,000 shares at ₹200.05 with almost no impact. Your cost is essentially the fair price.
Thin Co trades with a bid of ₹196 and an ask of ₹204 — a wide ₹8 spread — and only 200 shares sitting at ₹204. To get all 1,000 shares you eat through ₹204, then ₹206, then ₹209 as you climb the thin order book. You might pay an average near ₹207 instead of ₹200. That extra ~3.5% is the price of poor liquidity — a cost that never shows up as a fee but is real all the same.
Why liquidity matters
Liquidity affects far more than convenience:
- Trading cost. Tight spreads and good depth mean you pay close to the fair price; thin markets quietly tax every trade.
- Exit certainty. In a liquid asset you can usually get out quickly. In an illiquid one, selling in a hurry can force a painful discount.
- Price stability. Deep markets digest large orders calmly; shallow ones can lurch on a single sizeable trade.
- Stress behaviour. Liquidity tends to dry up exactly when markets are panicky, which is when smooth exits matter most.
This is one reason larger companies often behave more calmly than tiny ones — they are usually more liquid. It connects neatly to the idea of company size in market capitalisation and the large, mid and small cap buckets.
The honest catch
Liquidity is powerful to understand, but easy to misread:
- It is not constant. A stock can be liquid at midday and thin near the open, close, or during news. Liquidity is always shifting, not a fixed label.
- Quoted prices can be thin. A tight spread on screen may sit on top of very few shares; the real depth only shows when you try to trade size.
- High liquidity is not safety. A heavily traded asset can still fall hard. Liquidity tells you how easily you can trade, not which way the price will go.
- It can vanish under stress. The very moment everyone wants out is when buyers step back and spreads blow out.
Want to understand the plumbing of how trades actually clear, in plain language? TrueTrend presents market structure for curious learners — you can start free and explore.
Key takeaways
- Liquidity is how easily you can buy or sell without moving the price much.
- It is measured mainly by the bid-ask spread (a hidden cost) and depth (orders waiting near the price).
- Thin liquidity quietly taxes trades: in the example, a wide spread and shallow book turned a ₹200 purchase into roughly ₹207.
- Liquidity affects cost, exit certainty, and price stability — and it tends to evaporate exactly when markets are stressed.
- High liquidity means easy trading, not a promise that the price will rise.
See these concepts on live market data — free
Create a free TrueTrend account to watch daily support/resistance levels, market regime, and option-positioning charts on NIFTY, BankNifty and 12 more instruments. Every level we publish is scored on a public scoreboard — misses included. No card required.
Free forever tier · daily levels with published hit-rates across every instrument. Descriptive market structure, not investment advice.
Not ready for an account? Get the daily levels by email.
One short email each market day — the indices' call wall, put wall, gamma flip and max pain, and how the last session's levels scored. Free, no account, unsubscribe anytime.
Descriptive market structure, not investment advice. We never share your email.