Market Capitalisation: Large, Mid and Small Cap Explained
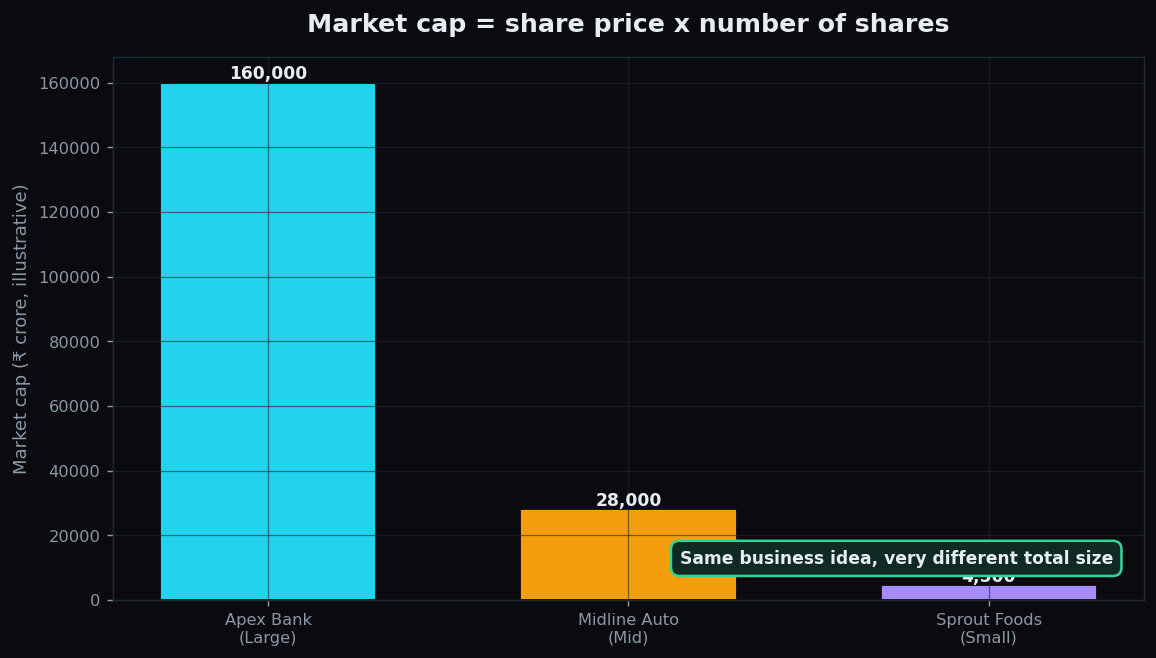
When people call a company “large-cap” or “small-cap,” they are talking about its market capitalisation — the total market value of the business. It is one of the first numbers worth understanding, because it quietly shapes how a stock tends to behave. This post explains what market cap is, how the size buckets work, and what each size hints at (and what it does not).
What market capitalisation is
Market capitalisation (market cap) is simply the share price multiplied by the total number of shares the company has issued:
Market cap = share price × number of shares
A helpful analogy: imagine a pizza cut into slices. The price of one slice is the share price, and the number of slices is the share count. To value the whole pizza you multiply the two — one expensive slice tells you little until you know how many slices there are. That is why share price alone is misleading: a stock priced at ₹50 can be a far bigger company than one priced at ₹5,000, depending on how many shares exist.
A worked example with round numbers
Take two imaginary companies (numbers invented for teaching):
- Tallshare Ltd: share price ₹2,000, with 1 crore shares. Market cap = 2,000 × 1,00,00,000 = ₹2,000 crore.
- Pennywide Ltd: share price ₹40, with 100 crore shares. Market cap = 40 × 1,00,00,00,000 = ₹4,000 crore.
Pennywide’s share price is 50 times cheaper, yet the company is twice as large by market cap. The lesson is blunt: a low share price does not mean a small company, and a high share price does not mean a big one. Always multiply by the share count.
The size buckets: large, mid and small cap
Companies are sorted into rough size groups. The exact rupee boundaries differ between regulators and index providers and they drift over time, so treat these as relative buckets, not fixed lines:
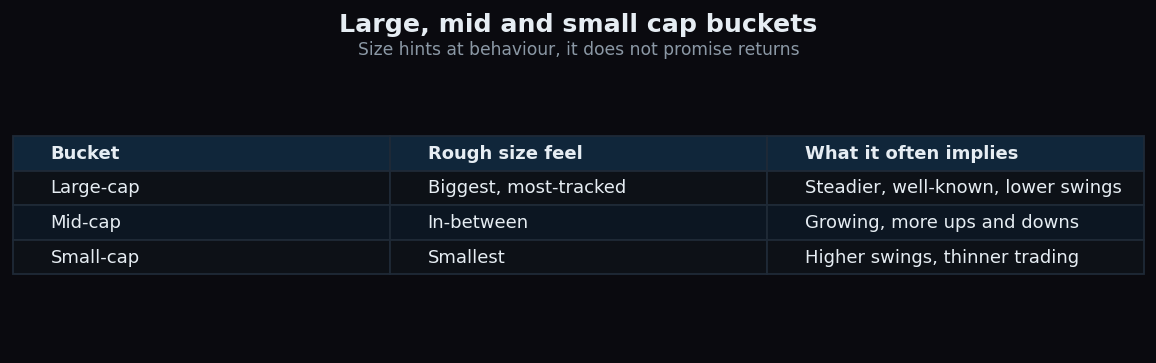
- Large-cap: the biggest, most widely tracked companies — household names with long records.
- Mid-cap: medium-sized firms, often still expanding, sitting between the giants and the minnows.
- Small-cap: the smallest listed companies, often younger or more niche.
In India, market regulator SEBI uses a simple ranking approach for mutual funds: by full market cap, the top 100 companies are large-cap, the next 150 (ranks 101–250) are mid-cap, and everything from rank 251 onward is small-cap. Because it is a ranking, a company can move between buckets as it grows or shrinks relative to others.
What size tends to imply
Size is not destiny, but it correlates with some general tendencies:
- Large-caps are usually more established and more heavily traded. Their prices often swing less violently, and lots of analysts follow them, so information is widely spread.
- Mid-caps sit in between: more room to grow than a giant, but typically bumpier than a large-cap.
- Small-caps can grow fast in percentage terms, but they tend to swing more and trade thinly — fewer buyers and sellers at any moment.
Notice the word tend. These are statistical leanings across many companies, not guarantees about any single one. A specific small-cap can be calmer than a specific large-cap; the buckets describe the crowd, not the individual.
Why market cap matters
Market cap is used as a quick lens in several ways:
- Apples-to-apples comparison. It lets you compare the true size of two companies regardless of their share prices.
- Index construction. Most major indices weight companies by (free-float) market cap, so bigger firms move the index more — see how a stock market index is built.
- Risk framing. Knowing whether something is large, mid, or small cap sets rough expectations for how widely it might swing.
- Fund labelling. Many funds are defined by the bucket they invest in, so the term shapes whole product categories.
The honest catch
Market cap is handy but partial. Keep its blind spots in view:
- It is not the full value of a business. Market cap ignores debt and cash. A fuller measure called enterprise value adds debt and subtracts cash, and can look very different.
- It moves with price, not just fundamentals. Because price is in the formula, market cap rises and falls with sentiment, not only with the company’s actual performance.
- The boundaries shift. What counts as “large” today may differ in a few years as the whole market grows, so the labels are relative.
- Size hints at behaviour, never at returns. Being large does not make a stock safe, and being small does not make it a winner. The bucket is context, not a verdict.
Want to see company size and market structure laid out in plain language while you learn? TrueTrend is built to make these basics clear — you can create a free account to explore.
Key takeaways
- Market cap = share price × number of shares, and it measures a company’s total market value — not its share price alone.
- A low share price can belong to a big company and vice versa; always multiply by the share count.
- Companies are sorted into large, mid and small cap buckets, which in India SEBI defines by rank (top 100, next 150, then the rest).
- Size hints at typical swing and trading depth, but it implies tendencies, never promised returns.
- Market cap ignores debt and cash and moves with sentiment, so it is one useful lens, not the whole picture.
See these concepts on live market data — free
Create a free TrueTrend account to watch daily support/resistance levels, market regime, and option-positioning charts on NIFTY, BankNifty and 12 more instruments. Every level we publish is scored on a public scoreboard — misses included. No card required.
Free forever tier · daily levels with published hit-rates across every instrument. Descriptive market structure, not investment advice.
Not ready for an account? Get the daily levels by email.
One short email each market day — the indices' call wall, put wall, gamma flip and max pain, and how the last session's levels scored. Free, no account, unsubscribe anytime.
Descriptive market structure, not investment advice. We never share your email.