What Is Slippage? The Hidden Cost of Trading
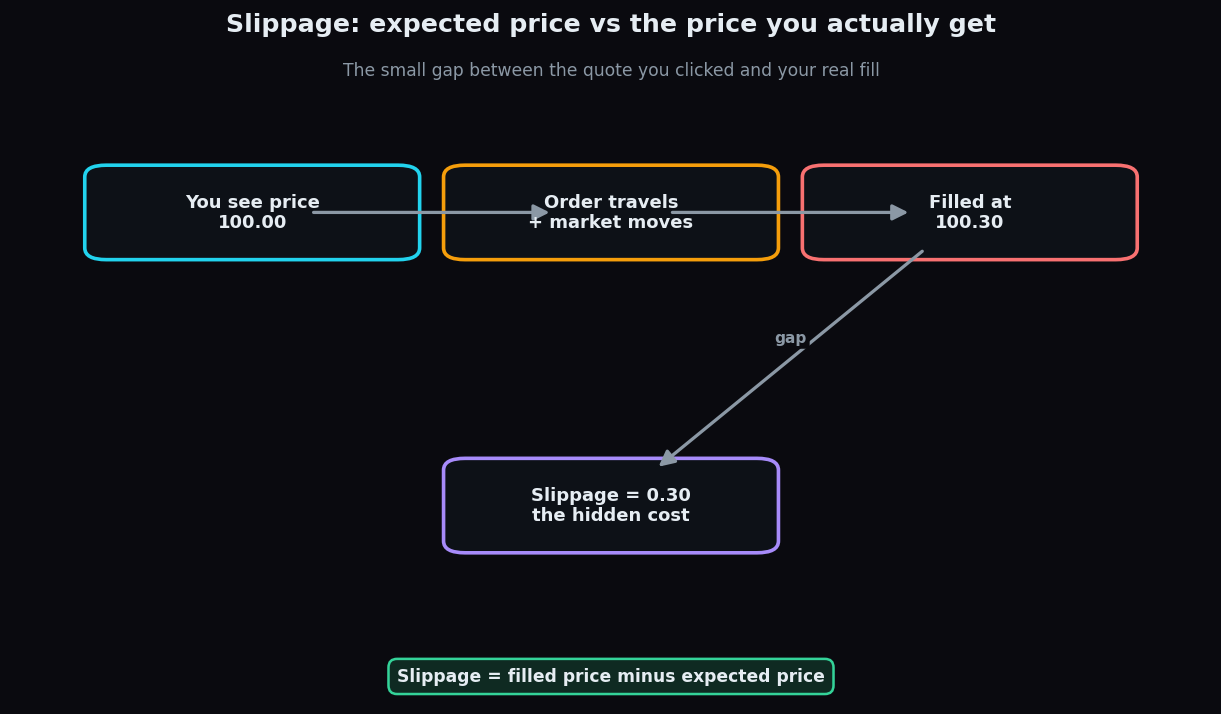
You see a price of ₹100.00 on screen, you click to trade, and the confirmation comes back at ₹100.30. Where did that extra 30 paise come from? Nobody cheated you — you just met slippage, the small, quiet gap between the price you expected and the price you actually got. It is one of the most underrated costs in trading, and it hides in plain sight.
What slippage is
Slippage is the difference between the price you expected to trade at and the price your order was actually filled at. If you expected ₹100.00 and filled at ₹100.30, your slippage is 30 paise per share against you. Slippage can occasionally work in your favour too — you might fill at ₹99.90 — but traders worry about it because the unfavourable side tends to show up more often when it matters.
An everyday analogy: imagine spotting a taxi fare quoted at ₹100 on an app. By the time you finish booking, demand has surged and the actual fare is ₹130. The headline number was real — it just was not locked in by the time you committed. Slippage is that surge pricing, scaled down to paise and milliseconds.
It is important not to confuse slippage with brokerage or taxes. Those are fixed, visible charges. Slippage is invisible: it is baked into your fill price, so it never appears as a separate line on your contract note.
What causes slippage
Two forces create almost all slippage, and they often combine.
- The market moves while your order travels. Between the instant you click and the instant the exchange matches your order, prices keep changing. In a fast-moving market, that tiny delay is enough for the price to shift.
- There aren't enough shares at your price. The order book has limited quantity at each price level. If you want more shares than are available at ₹100.00, the rest of your order has to fill at the next-best prices ₹100.05, ₹100.10, and so on.
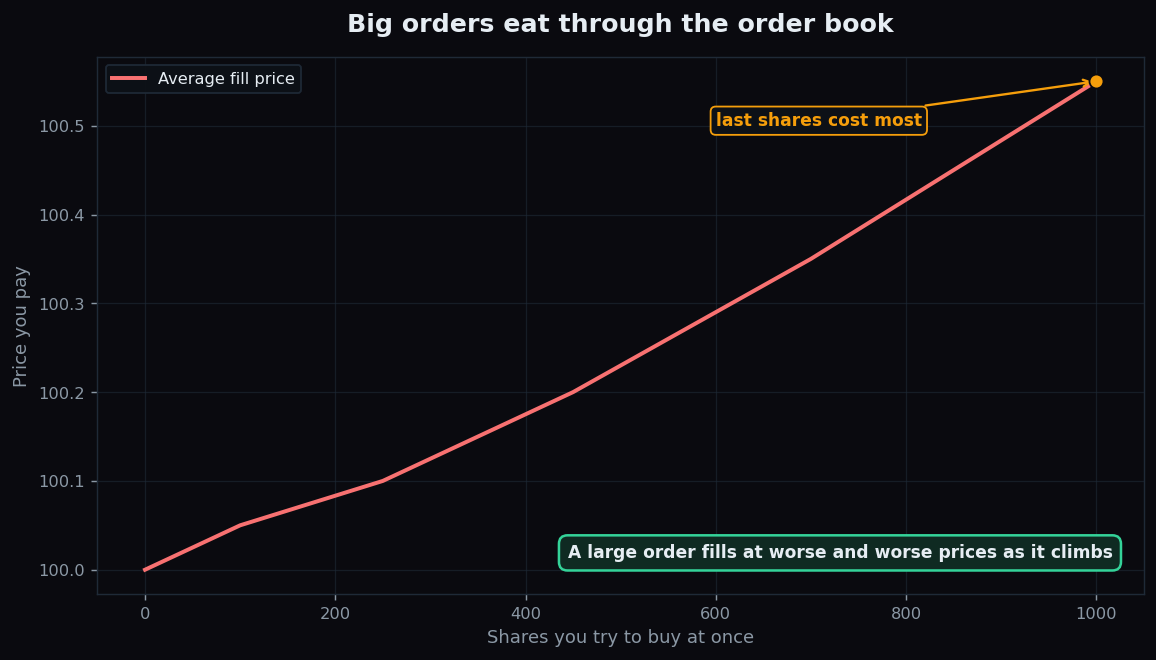
That second cause is why large orders "walk the book". Picture the sell side of the order book: 100 shares offered at ₹100.00, another 150 at ₹100.05, 200 more at ₹100.10, and so on. If you place a market order for 700 shares, you sweep through all those levels and your average fill ends up well above the first price you saw. The bigger the order relative to what's available, the worse the average.
How slippage grows — and a worked example
Slippage is small in calm, liquid conditions and balloons in fast or thin markets. Liquidity — how many shares are readily available to trade near the current price — is the key factor. Deep liquidity absorbs your order with barely a ripple; shallow liquidity makes it splash.
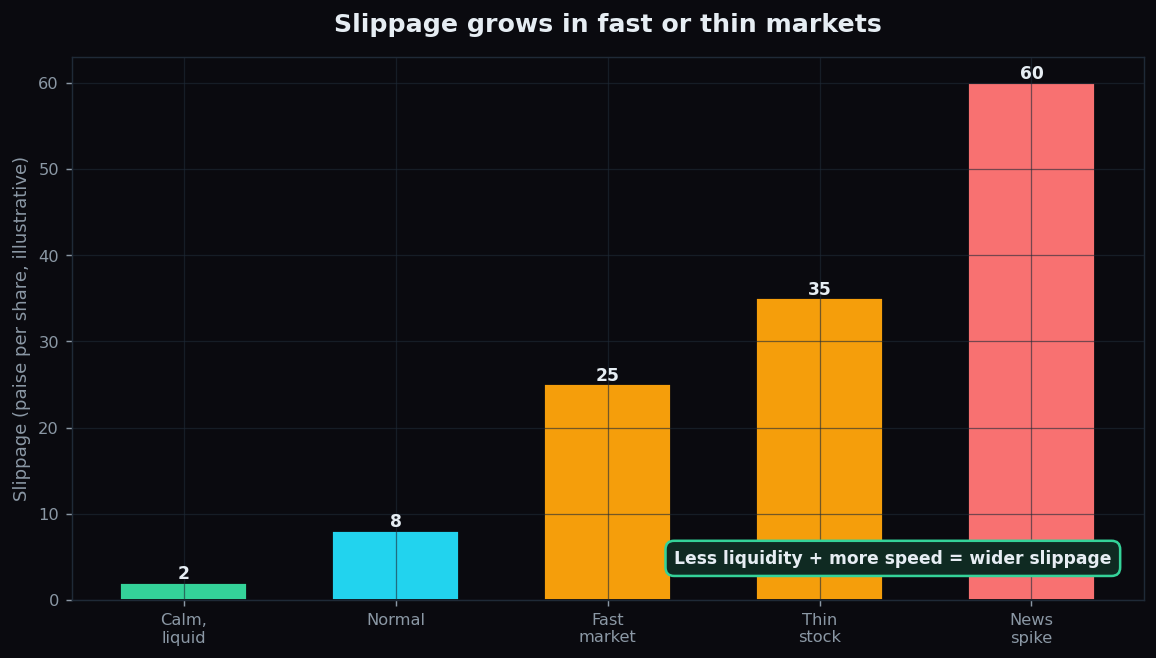
Here is a clean worked example. You want to buy 1,000 shares and the screen shows ₹100.00.
- Calm, liquid stock: plenty of shares sit right at ₹100.00. You fill at an average of ₹100.02. Slippage = 2 paise × 1,000 = ₹20. Barely noticeable.
- Thin or fast market: only a few hundred shares are available near ₹100.00, so you walk up to an average of ₹100.35. Slippage = 35 paise × 1,000 = ₹350. Same intention, very different cost.
Notice nothing "went wrong" in either case. The order simply met the reality of the order book. This is why active traders care so much about liquidity, and why slippage tends to be largest around news, at the open, near expiry, and in lightly traded stocks. It compounds with the expected daily range too: the wider a market is swinging, the more room there is to fill away from your quote.
The honest catch
Slippage cannot be eliminated, only managed — and even the management has trade-offs.
- Market orders trade speed for price. A market order fills fast but accepts whatever price the book offers, so it is most exposed to slippage.
- Limit orders trade certainty of price for certainty of fill. A limit order caps the price you'll accept, but if the market moves away, it may not fill at all. You dodge slippage and risk a missed trade instead.
- It scales with size. The same stock can have trivial slippage for 100 shares and painful slippage for 1,00,000. There is no single "slippage number".
- Backtests often ignore it. A strategy that looks profitable on paper can quietly turn negative once realistic slippage is subtracted. Always assume real fills are a little worse than the screen.
The honest takeaway: treat slippage as a real, ever-present cost — small when the market is deep and calm, and surprisingly large when it is thin and fast.
Hidden costs like slippage are why understanding market structure beats chasing tips — and that plain-English structure is exactly what TrueTrend focuses on. Start free to learn how markets really fill, one concept at a time.
Key takeaways
- Slippage is the gap between your expected price and your actual fill price — an invisible, built-in cost.
- It is caused by the market moving while your order travels, and by not enough shares being available at your price.
- Large orders "walk the book", filling at progressively worse prices, so slippage scales with order size.
- It is small in calm, liquid markets and grows sharply in fast, thin, or news-driven conditions.
- Market orders are most exposed; limit orders cap price but risk not filling. You cannot remove slippage, only manage it.
See these concepts on live market data — free
Create a free TrueTrend account to watch daily support/resistance levels, market regime, and option-positioning charts on NIFTY, BankNifty and 12 more instruments. Every level we publish is scored on a public scoreboard — misses included. No card required.
Free forever tier · daily levels with published hit-rates across every instrument. Descriptive market structure, not investment advice.
Not ready for an account? Get the daily levels by email.
One short email each market day — the indices' call wall, put wall, gamma flip and max pain, and how the last session's levels scored. Free, no account, unsubscribe anytime.
Descriptive market structure, not investment advice. We never share your email.