What Is Technical Analysis? A Plain-English Guide
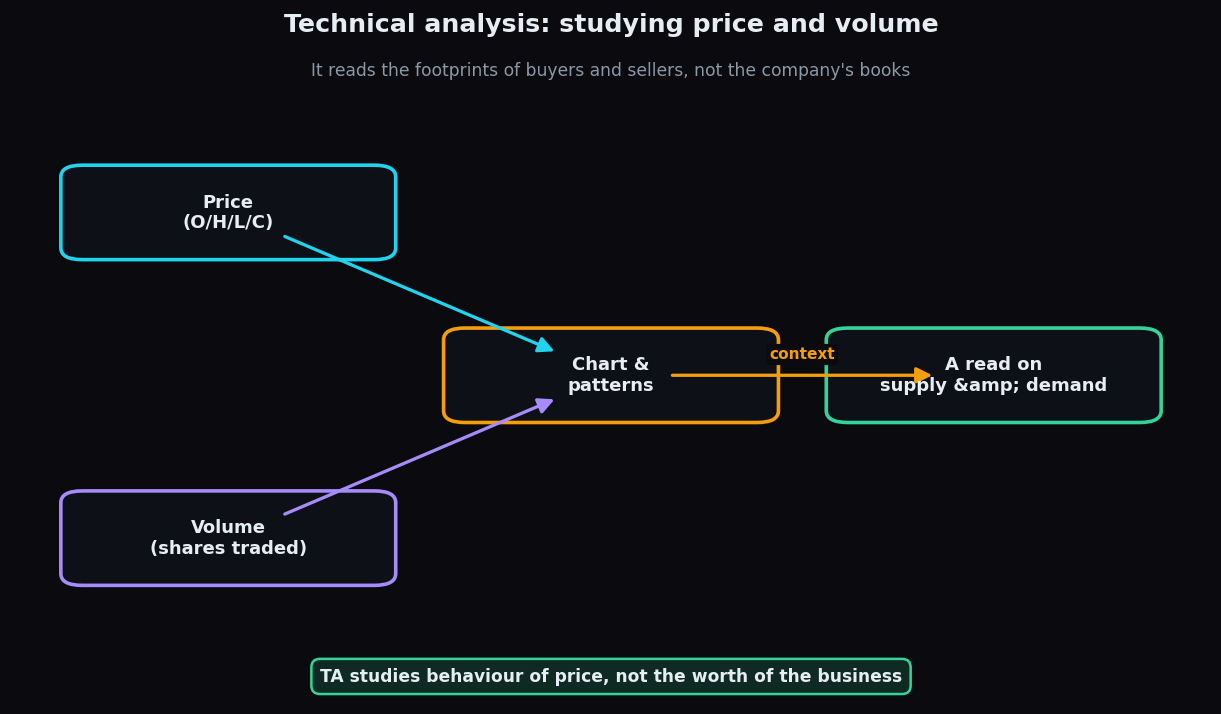
Open any trading screen and you will see a chart of wiggly lines. Technical analysis — "TA" for short — is the craft of studying those wiggles. It is the study of price and volume to understand how buyers and sellers are behaving right now. It does not try to work out what a company is truly worth. It simply reads the footprints left in the price.
What technical analysis actually is
Technical analysis looks at two raw ingredients: price (where a stock or index traded — its open, high, low and close) and volume (how many shares or contracts changed hands). From these, an analyst builds a chart and looks for structure: trends, levels where price keeps pausing, and recurring shapes. The whole field rests on one idea — that the collective actions of millions of buyers and sellers leave readable patterns in the price.
Think of a beach at low tide. You did not see the people who walked there, but their footprints tell you where they went, how fast, and whether they hurried back. Technical analysis treats price the same way: the footprints of every trade, read after the fact.
The core assumptions
TA is usually built on three classic claims, each worth stating plainly:
- Price reflects everything known. News, earnings, hopes and fears are already baked into the latest price, so the price itself is the thing to study.
- Price moves in trends. Once a direction takes hold, it tends to persist for a while rather than reverse at random — until it clearly stops.
- History tends to rhyme. Because human behaviour repeats, the shapes that formed before tend to show up again. This is a tendency, not a law.
Why it matters
A chart turns a flood of numbers into something a person can actually read. Instead of staring at thousands of trades, you see a picture: is price drifting up, down, or sideways? Where did it stall last time? Is today's move backed by heavy volume or barely any? That structure is what most short-term market participants are reacting to, so understanding it helps you understand the crowd you are trading alongside.
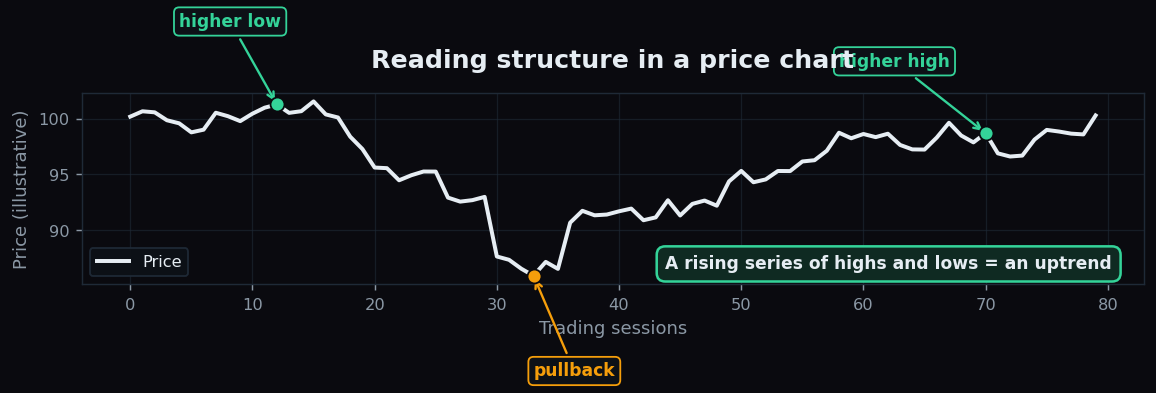
The chart above shows the most basic structure of all: a series of higher highs and higher lows. When each peak and each dip sits above the last, that is the textbook shape of an uptrend. Spotting that shape is step one of reading any chart.
Technical vs fundamental analysis
The other big school is fundamental analysis, which studies the business itself — revenue, profit, debt, management, the economy — to estimate what a share is worth. A simple way to hold both in your head:
- Fundamental analysis asks "what is it worth, and why?" It is mostly about value and works on longer horizons.
- Technical analysis asks "what is it doing, and when?" It is mostly about timing and price behaviour.
They are not enemies. Many people use fundamentals to decide what to study and technicals to understand when the crowd is leaning one way. Neither tells the future; both are lenses.
How it is used in practice
Most chart reading is built from a small toolkit. A beginner usually meets these first:
- Trend — the general direction, up, down, or sideways.
- Support and resistance — price levels where buying or selling has repeatedly shown up.
- Moving averages — a smoothed line of recent prices that shows the underlying drift. Our guide to moving averages walks through these in detail.
- Volume — used to judge whether a move has real participation behind it.
Here is a deliberately simple, illustrative worked example — an example, not a recommendation. Suppose a stock has bounced near ₹100 three separate times over a month, and each time it rose afterward. A chart reader would mark ₹100 as a support level — a price where buyers have repeatedly appeared. That does not mean ₹100 will hold again. It simply describes where the crowd reacted before, which is context, not a prediction.
The honest catch
Technical analysis has real limits, and good analysts say so out loud:
- It is descriptive, not predictive. A pattern describes what has happened. The next move is always uncertain.
- It is subjective. Two people can draw two different trend lines on the same chart and reach opposite reads.
- Patterns fail often. A "textbook" shape can simply not play out. There is no setup with a certain outcome.
- It can become a hall of mirrors. Stare long enough and you will "see" a pattern in pure noise.
The sane way to treat TA is as a structured vocabulary for describing market behaviour and managing risk — not as a crystal ball. Anyone promising certainty from a chart is selling confidence, not analysis.
Want to see chart structure tracked honestly, with the hits and the misses laid out in the open? TrueTrend publishes a transparent analytics scoreboard so you can judge the evidence for yourself instead of taking anyone's word for it.
Key takeaways
- Technical analysis studies price and volume to read how buyers and sellers are behaving — not what a company is worth.
- It rests on three classic assumptions: price reflects what is known, price moves in trends, and behaviour tends to repeat.
- Fundamental analysis asks what something is worth; technical analysis asks what it is doing and when.
- The beginner toolkit is small: trend, support and resistance, moving averages, and volume.
- TA is descriptive and subjective; patterns fail often, and no chart predicts the future.
See these concepts on live market data — free
Create a free TrueTrend account to watch daily support/resistance levels, market regime, and option-positioning charts on NIFTY, BankNifty and 12 more instruments. Every level we publish is scored on a public scoreboard — misses included. No card required.
Free forever tier · daily levels with published hit-rates across every instrument. Descriptive market structure, not investment advice.
Not ready for an account? Get the daily levels by email.
One short email each market day — the indices' call wall, put wall, gamma flip and max pain, and how the last session's levels scored. Free, no account, unsubscribe anytime.
Descriptive market structure, not investment advice. We never share your email.