What Is Volume in Trading and Why It Matters
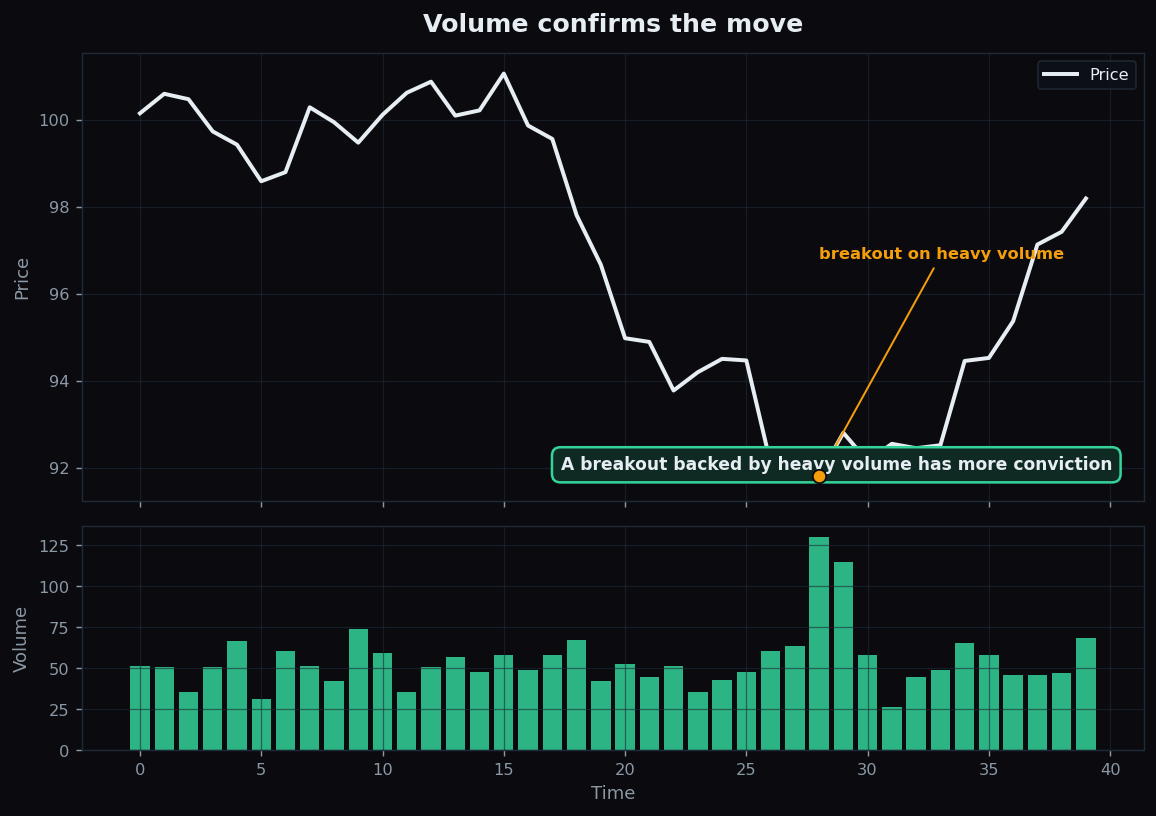
Price tells you where a stock is. Volume tells you how many people care. A move on huge volume and the same move on a sleepy, near-empty day mean very different things — even if the price chart looks identical. Volume is the crowd size behind every price, and once you start reading it, charts stop being just squiggly lines.
What volume is
Volume is simply the number of shares (or contracts) traded in a given period — a minute, an hour, a day. If 2,00,000 shares of a company change hands today, today's volume is 2,00,000. Every share that is bought is also sold, so volume counts the activity, not the direction.
Here is the key idea: each unit of volume is one share that a buyer and a seller agreed to exchange at a price. High volume means lots of people are actively agreeing on prices right now. Low volume means only a handful are, and the rest are watching.
An everyday analogy: imagine a small shop quietly raising its prices on a slow Tuesday afternoon with two customers inside. Now imagine the same price rise during a packed festival-day rush with a queue out the door. The second one is far more convincing — the whole crowd accepted the new price. Volume is that crowd size.
Why volume matters
On its own, volume is just a count. Its power comes from pairing it with price. The single most useful idea is confirmation: a price move backed by rising volume has more conviction behind it than the same move on falling or thin volume.
- Breakout with heavy volume: price pushes above a level that had capped it for days, and volume jumps. Many participants are taking part in the move, so it tends to carry more weight.
- Breakout on thin volume: price nudges past the same level but volume stays sleepy. Fewer people are behind it, so it is easier for the move to fizzle and slip back.
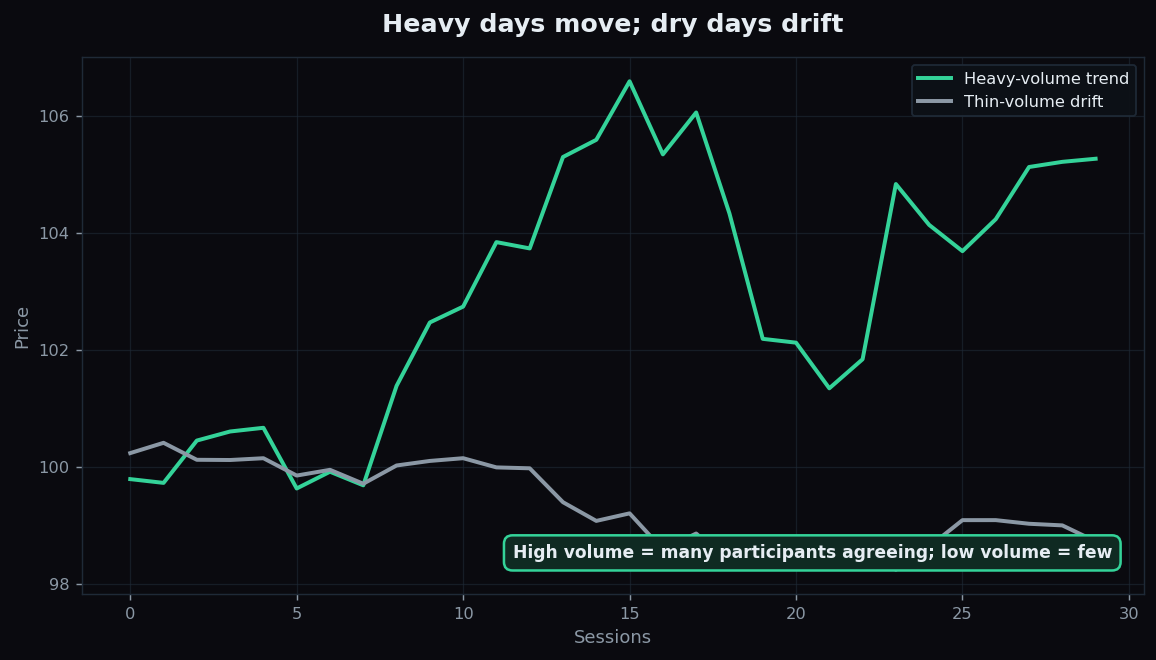
Note the careful wording: volume raises or lowers conviction. It is context, never a crystal ball. A heavy-volume move can still reverse; a quiet move can still run. Volume shifts the odds in your understanding, it does not promise an outcome.
How volume is used — a worked example
Suppose a stock has traded an average of 1,00,000 shares a day for the past month. That average is your baseline — the "normal" crowd. Now two things happen on two different days:
- Day A: Price rises 3% and volume is 3,00,000 shares — three times normal. A big crowd showed up to push the price up. The move is well-attended.
- Day B: Price rises the same 3% but volume is only 40,000 shares — well below normal. The same price change happened, but on a thin, half-empty floor. Far fewer participants stand behind it.
Same price move, very different backing. Comparing today's volume to its own recent average is the heart of volume reading. The exact number does not matter as much as "heavier or lighter than usual?"
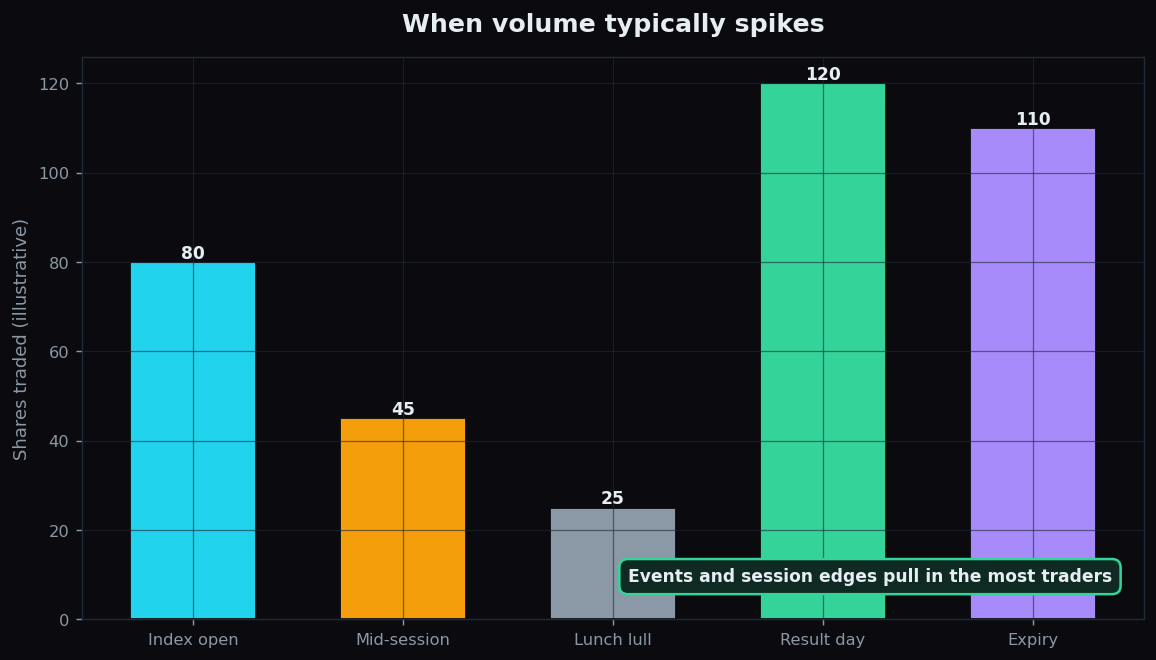
Volume also has natural rhythms. It tends to be heaviest near the market's open and close, around company results, and on derivative expiry days, while drying up in the mid-session lull. A spike against that backdrop — like a results day or a fresh breakout — is what draws attention. If you want to layer this on top of trend tools, our explainer on moving averages pairs naturally with volume reading.
The honest catch
Volume is genuinely useful, but it comes with real limits.
- It is not directional. High volume can accompany a rise or a fall. It tells you how many people traded, not who "won".
- Thin stocks distort it. In a low-liquidity stock, a single large order can make volume look huge for one day and mean very little.
- Index and futures volume differ from cash. Comparing volumes across different instruments is apples to oranges; always compare a stock to its own history.
- Spikes can be technical. Index rebalances, block deals, and expiry can inflate volume for reasons unrelated to fresh opinion.
The honest summary: volume is a conviction gauge, not a signal by itself. It is best used to ask "is this move well-attended or not?" — and then to stay humble about the answer.
Reading volume well is about context, not predictions — and context is exactly what TrueTrend is built to surface in plain language. Start free to explore the structure behind market moves at your own pace.
Key takeaways
- Volume is the number of shares or contracts traded in a period — the crowd size behind a price.
- It is most useful for confirmation: a move on heavy volume has more conviction than the same move on thin volume.
- Always compare today's volume to a stock's own recent average, not to other instruments.
- Volume is not directional and is no guarantee — heavy-volume moves can still reverse.
- Spikes cluster around opens, closes, results, and expiry; treat one-off spikes in thin stocks with caution.
See these concepts on live market data — free
Create a free TrueTrend account to watch daily support/resistance levels, market regime, and option-positioning charts on NIFTY, BankNifty and 12 more instruments. Every level we publish is scored on a public scoreboard — misses included. No card required.
Free forever tier · daily levels with published hit-rates across every instrument. Descriptive market structure, not investment advice.
Not ready for an account? Get the daily levels by email.
One short email each market day — the indices' call wall, put wall, gamma flip and max pain, and how the last session's levels scored. Free, no account, unsubscribe anytime.
Descriptive market structure, not investment advice. We never share your email.