What Is Volatility? Why Prices Swing, Up and Down
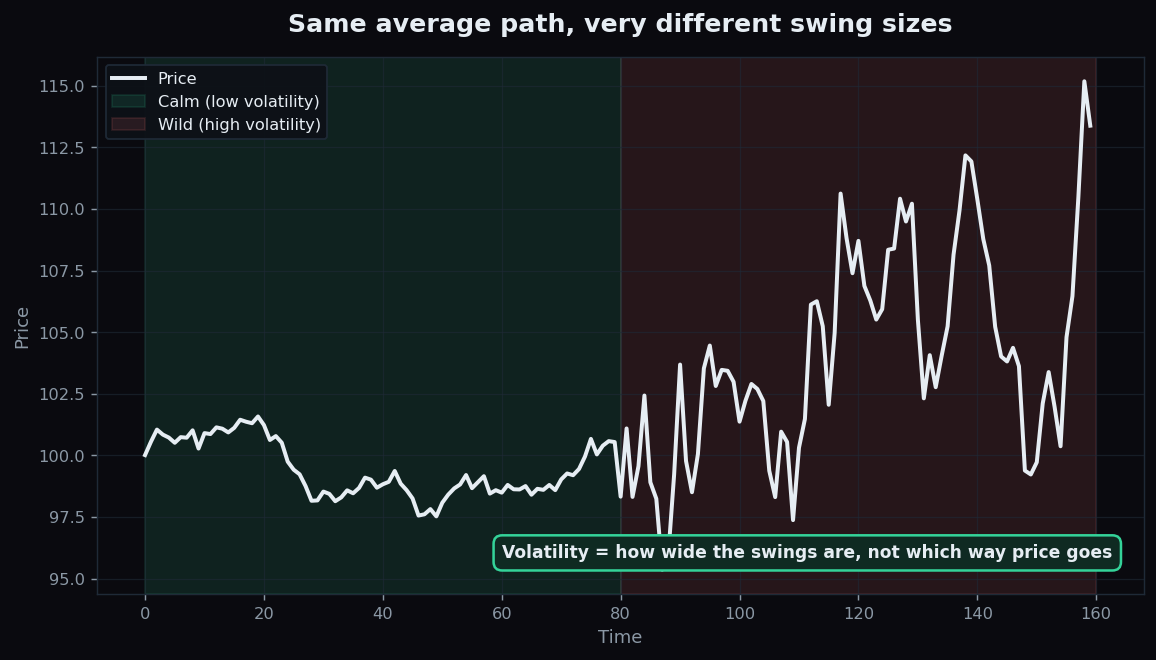
Volatility is the market’s word for how wildly prices swing. A calm, low-volatility stretch drifts in small steps; a high-volatility stretch lurches up and down in big jumps. The single most important thing to grasp is also the most misunderstood: volatility measures the size of the swings, not the direction. This post explains what volatility really is, how calm and wild regimes differ, and why high volatility does not mean “going down.”
What volatility actually measures
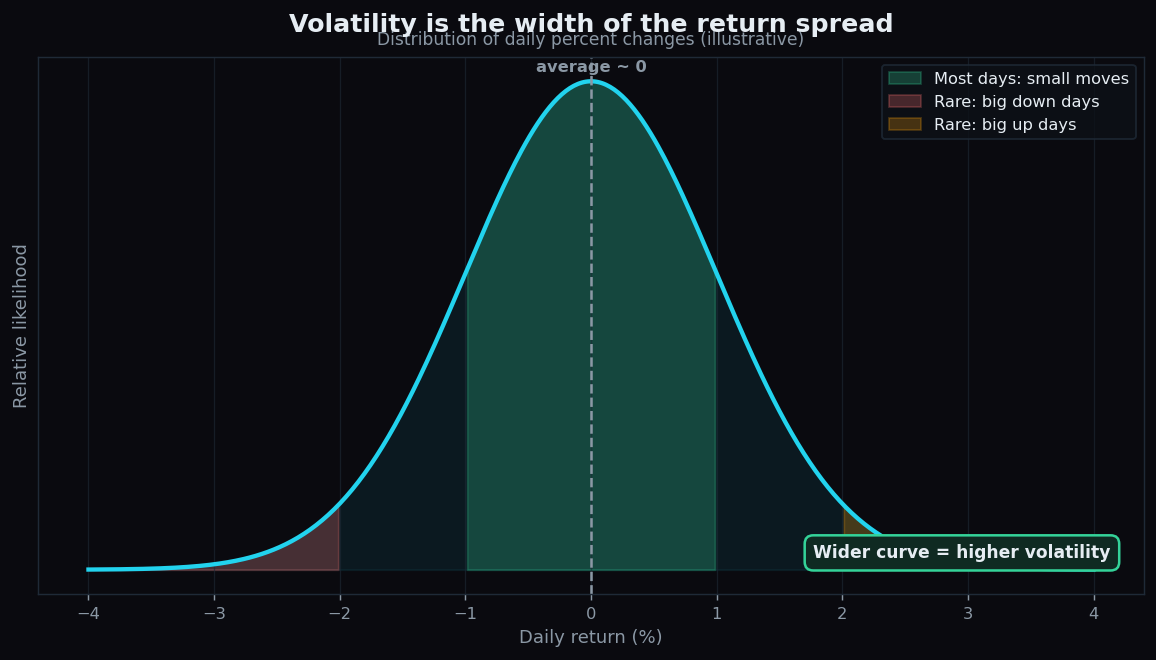
Volatility is the spread, or scatter, of an asset’s returns over time — how far daily moves tend to stray from their average. If a stock usually moves a tiny bit each day, it is low-volatility. If it routinely jumps several percent in either direction, it is high-volatility.
An everyday analogy: think of two car journeys covering the same distance. One cruises at a steady speed the whole way — smooth, predictable, low volatility. The other surges and brakes, surges and brakes — same trip, but a jerky, stomach-churning ride; that is high volatility. Crucially, both cars can arrive at the same place. The roughness of the ride is separate from where you end up.
Calm regimes versus wild regimes
Markets tend to move through regimes — stretches with a consistent character — rather than behaving the same way forever.
- Calm (low-volatility) regimes: small daily moves, quiet news, prices drifting. These often feel boring and can persist for a while.
- Wild (high-volatility) regimes: large daily moves in both directions, often around shocks or uncertainty. They tend to be more dramatic but frequently shorter.
A well-known quirk is that volatility clusters: calm days tend to follow calm days, and wild days tend to follow wild days. Big moves rarely arrive alone. That is why a sudden jump in volatility often signals that the character of the market has shifted, even before anyone knows which way prices will settle.
A worked example with round numbers
Compare two imaginary stocks over five days, looking only at the size of each daily move (numbers invented for teaching).
- Steady Ltd moves: +0.3%, −0.2%, +0.4%, −0.1%, +0.2%. The swings are tiny — roughly a quarter of a percent each. Low volatility.
- Jumpy Ltd moves: +3%, −4%, +5%, −3%, +2%. The swings are huge — several percent each. High volatility.
Here is the key twist: add up the moves. Steady Ltd nets about +0.6% over the week; Jumpy Ltd nets about +3%. Both ended up. Volatility told you how bumpy each ride was, not whether the destination was higher or lower. A volatile stock can finish the week up, down, or flat — the volatility figure alone cannot tell you which.
Why volatility matters
Even though it says nothing about direction, volatility is hugely useful:
- It sizes the risk. A wider spread of outcomes means a bigger range of where price could be tomorrow — helpful for setting expectations.
- It frames option prices. Options cost more when expected volatility is high, because a wider swing range makes them more likely to pay off. The market’s estimate of future volatility is even baked into a measure called implied volatility.
- It signals regime change. A jump from calm to wild often marks a shift in conditions worth paying attention to.
- It shapes the expected range. Volatility is the engine behind a stock’s likely daily range — the idea explored in how option prices imply a daily expected move.
The honest catch
Volatility is precise about one thing and silent about another. Hold both in mind:
- It is direction-blind. High volatility does not mean “falling.” Sharp up-moves count just as much as sharp down-moves. The crash association is a common myth.
- It is backward- or estimate-based. Measured volatility looks at the past; implied volatility is the market’s guess. Neither is a promise about the next move.
- It changes. Today’s calm can flip to tomorrow’s storm. A low reading is not a guarantee of continued quiet.
- Averages hide tails. A typical-looking volatility number can still sit alongside the occasional extreme day. Rare big moves are part of the picture, not exceptions to it.
Want to see how calm and turbulent market conditions are read in plain language? TrueTrend turns market context into something a learner can follow — you can create a free account to explore.
Key takeaways
- Volatility measures the size of price swings — the spread of returns — not the direction.
- Markets move through calm and wild regimes, and volatility tends to cluster: big moves arrive in groups.
- In the example, a low-volatility and a high-volatility stock both finished the week up — the swing size said nothing about the outcome.
- Volatility frames risk, drives option prices, and flags regime changes, but it is direction-blind and always an estimate.
- High volatility does not mean “crash” — sharp rises count exactly the same as sharp falls.
See these concepts on live market data — free
Create a free TrueTrend account to watch daily support/resistance levels, market regime, and option-positioning charts on NIFTY, BankNifty and 12 more instruments. Every level we publish is scored on a public scoreboard — misses included. No card required.
Free forever tier · daily levels with published hit-rates across every instrument. Descriptive market structure, not investment advice.
Not ready for an account? Get the daily levels by email.
One short email each market day — the indices' call wall, put wall, gamma flip and max pain, and how the last session's levels scored. Free, no account, unsubscribe anytime.
Descriptive market structure, not investment advice. We never share your email.