Change in OI vs Total OI: How to Spot Fresh Positions
Open an option chain and you will see two OI columns sitting side by side: OI (total open interest) and change in OI. They look similar, and most beginners treat them as the same thing. They are not. One tells you where positions have piled up over days and weeks. The other tells you where money moved today. Knowing the difference is how you separate old, stale positioning from fresh activity.
First, a quick refresher: what is open interest?
Open interest (OI) is the number of option contracts that are currently open — created but not yet closed or expired. Every contract needs two sides: one trader who bought it and one who wrote (sold) it. When a brand-new contract is created between them, OI goes up by one. When both sides close out an existing contract, OI goes down by one.
If that idea is new to you, our short explainer on open interest vs volume covers the basics. Here we go one level deeper.
The hotel analogy: occupied rooms vs today's check-ins
Think of an option strike as a hotel.
- Total OI is the number of rooms occupied right now. Some guests checked in this morning; others have been there for two weeks.
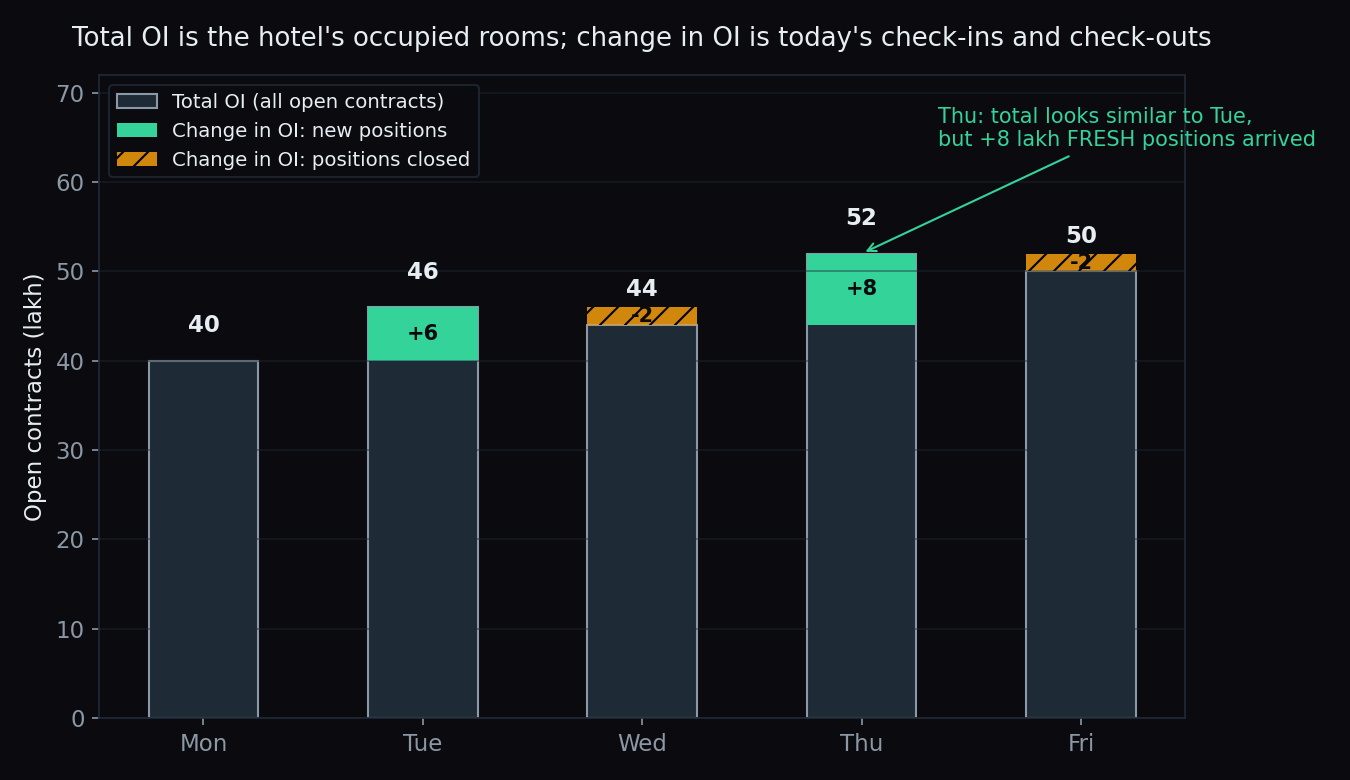
- Change in OI is today's check-ins minus today's check-outs. It ignores everyone who was already staying and counts only today's movement at the front desk.
A hotel with 500 occupied rooms sounds busy. But if 40 guests checked out today and only 5 checked in, the hotel is quietly emptying. The headline number (500) hides the direction of travel. The daily change (−35) reveals it. Option strikes work exactly the same way.
In the chart above, Thursday's total (52 lakh) looks only slightly different from Tuesday's (46 lakh). But the green block shows +8 lakh fresh contracts arrived that day — the single busiest day of the week for new positioning. Total OI alone would never show you that.
Why fresh positions matter more than old ones
Total OI is a photograph of everything that has accumulated — including positions opened weeks ago at very different price levels, for reasons that may no longer apply. Change in OI is today's footage. It shows where participants are committing new money right now, at current prices, with current information.
That distinction matters because markets react to new commitments. A strike where OI is actively growing is a strike where writers are confident enough to add exposure today. A strike with a huge but shrinking OI pile is one where participants are quietly walking away.
The four combinations of price and change in OI
Traders in India often read change in OI on futures (and heavily traded strikes) alongside the price move to label what kind of activity happened. There are four combinations:
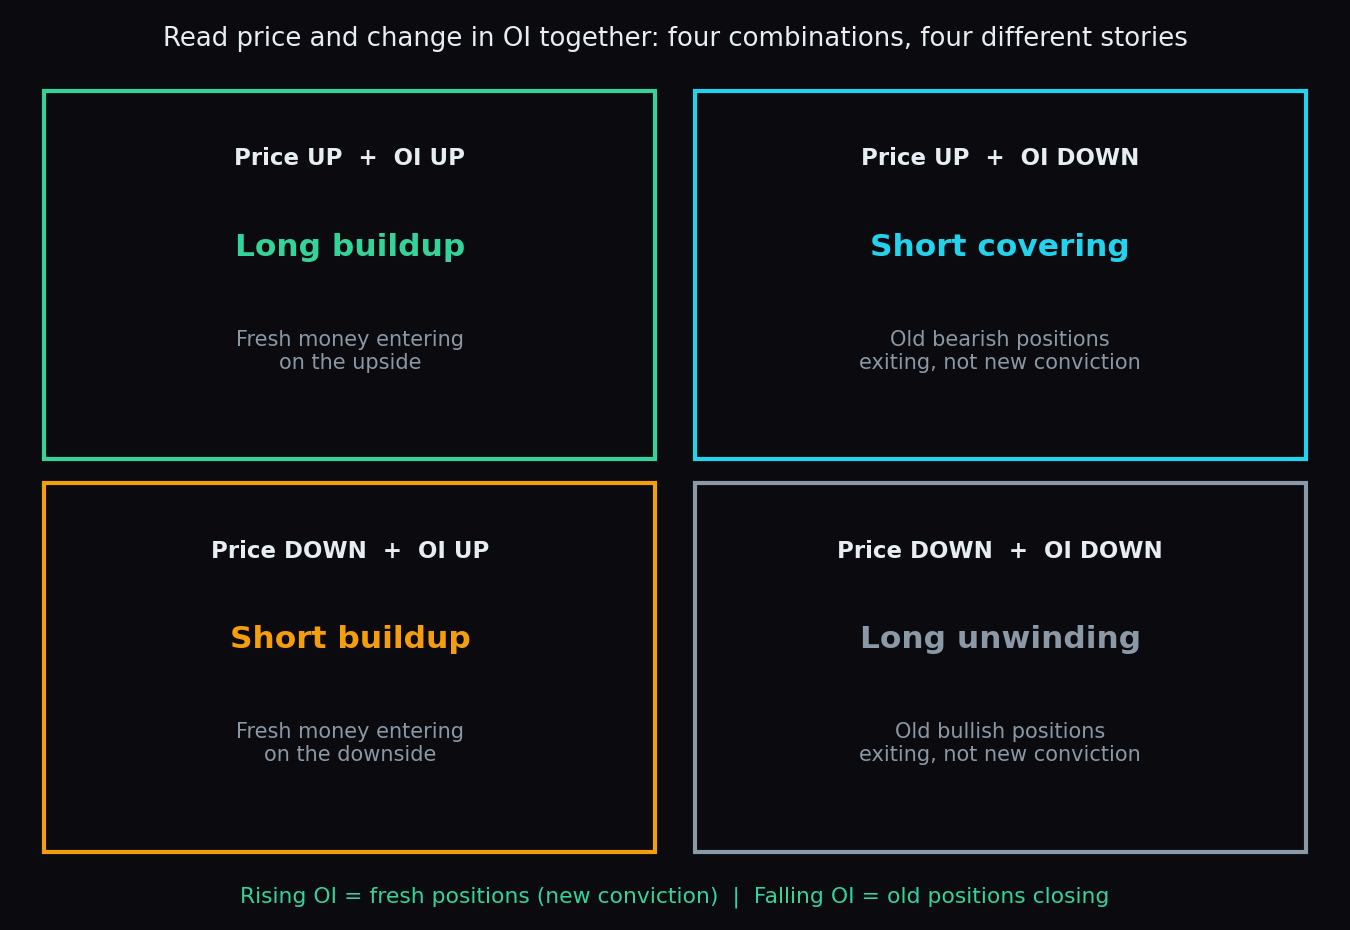
- Price up + OI up = long buildup. New contracts are being created while price rises. Fresh money is entering on the upside.
- Price up + OI down = short covering. Price is rising but contracts are being closed. Traders who were positioned for a fall are exiting. The rally is fuelled by exits, not new conviction.
- Price down + OI up = short buildup. New contracts created while price falls. Fresh money is entering on the downside.
- Price down + OI down = long unwinding. Price falling while contracts close. Older bullish positions are being abandoned.
The common thread: rising OI means fresh positions; falling OI means old positions closing. The price direction tells you which side the fresh money leans. These labels are descriptions of what already happened — not predictions of what happens next.
A worked example with simple numbers
Suppose the NIFTY 25,000 call shows a total OI of 50 lakh contracts — the biggest number on the chain. Impressive. But today's change in OI at that strike is −6 lakh: more contracts closed than opened. Meanwhile the 25,100 call shows a smaller total of 34 lakh, but today's change is +12 lakh.
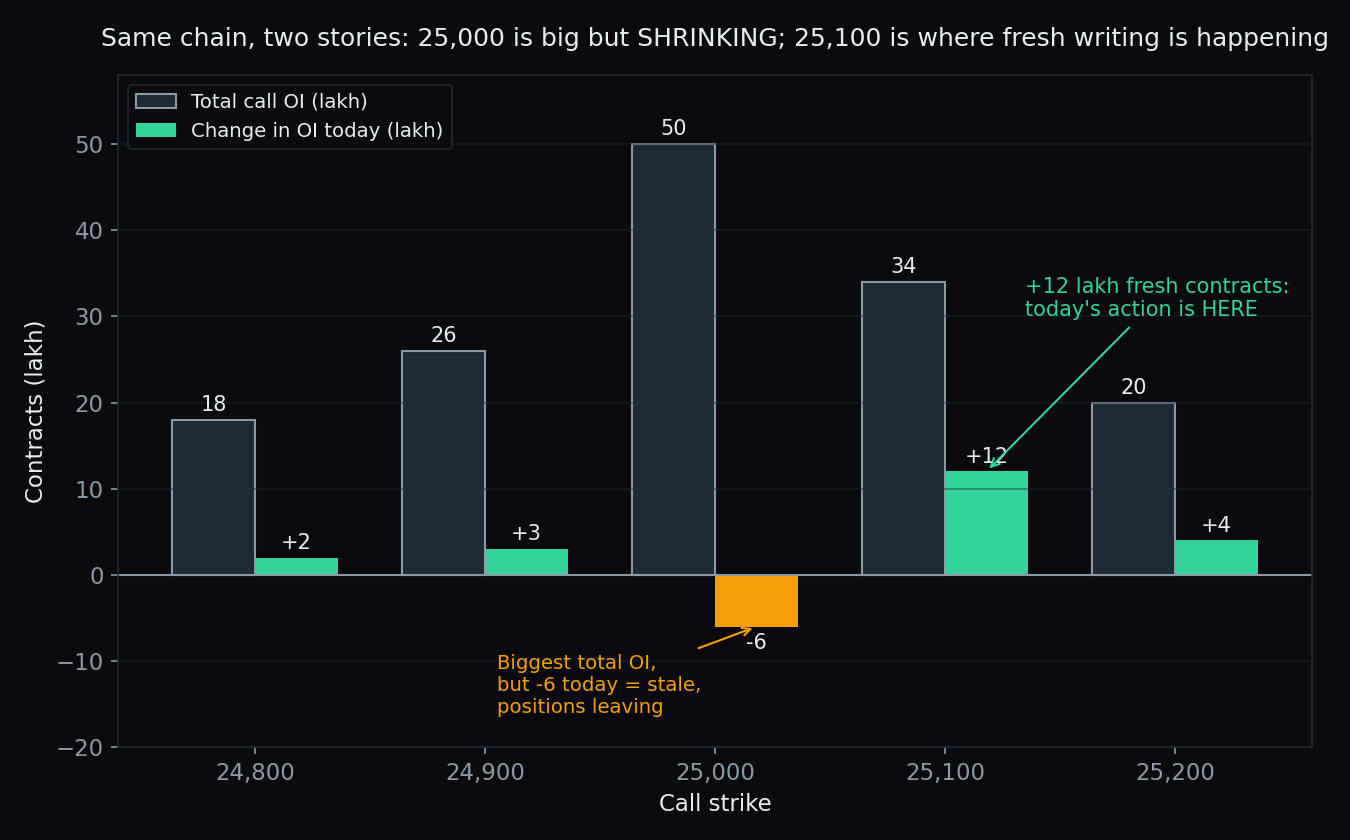
Read together, the two columns tell a story the total alone cannot:
- The 25,000 pile is old. It was built over previous sessions, and today it is shrinking — some participants are unwinding.
- The 25,100 strike is where today's commitment is happening. Fresh call writing (or fresh call interest — more on that catch below) is concentrating one strike higher.
If you only ranked strikes by total OI, you would call 25,000 the key level and stop there. The change column suggests the more current activity has migrated to 25,100. If reading a chain is new to you, start with our 5-minute option chain guide and come back.
How this connects to option walls
Large concentrations of call or put OI are often called walls — strikes where heavy positioning may act as a brake on price. Walls are built from total OI. Change in OI tells you whether a wall is being reinforced (fresh contracts added) or dismantled (contracts closing) — which is useful context, because a wall that is actively shrinking is not the same obstacle as one that is growing.
Do walls actually hold? We measure this in public rather than assume it. On our live scoreboard, the NIFTY call wall has held on 75% of the sessions where price touched it (n=16), and the put wall on 70% of touches (n=23). Useful odds — but note the small sample sizes, and note that "held when touched" is a measured tendency, not a rule.
Key takeaway: total OI shows where positions are; change in OI shows where positions are being created or closed today. Neither number predicts direction on its own — they describe positioning, and positioning can change by tomorrow morning.
The honest catch: what change in OI cannot tell you
- It cannot tell you who initiated. OI rises whether an aggressive buyer lifted the offer or an aggressive writer hit the bid. A +12 lakh change means fresh contracts exist — it does not say which side was the confident one. (In index options, heavy OI additions are often writer-driven, but the chain does not label it for you.)
- Expiry distorts everything. Near expiry, OI mechanically collapses as contracts settle, and positions roll to the next series. A big negative change on expiry week is often just housekeeping, not a signal.
- Intraday change resets daily. The change column compares against the previous day's close of OI. A strike can swing positive and negative within a single session.
- It describes, it does not predict. Long buildup can unwind the very next day. Treat these labels as a reading of what happened, not a forecast.
Watching two OI columns across dozens of strikes, every day, is tedious. TrueTrend turns this market structure into a clear, at-a-glance read across Nifty, Bank Nifty and F&O — and scores its own track record in public, so you can see what held up before you rely on it. Create a free account to see today's positioning.
See these concepts on live market data — free
Create a free TrueTrend account to watch daily support/resistance levels, market regime, and option-positioning charts on NIFTY, BankNifty and 12 more instruments. Every level we publish is scored on a public scoreboard — misses included. No card required.
Free forever tier · daily levels with published hit-rates across every instrument. Descriptive market structure, not investment advice.
Not ready for an account? Get the daily levels by email.
One short email each market day — the indices' call wall, put wall, gamma flip and max pain, and how the last session's levels scored. Free, no account, unsubscribe anytime.
Descriptive market structure, not investment advice. We never share your email.