Implied Volatility Explained for Beginners: IV vs Realised
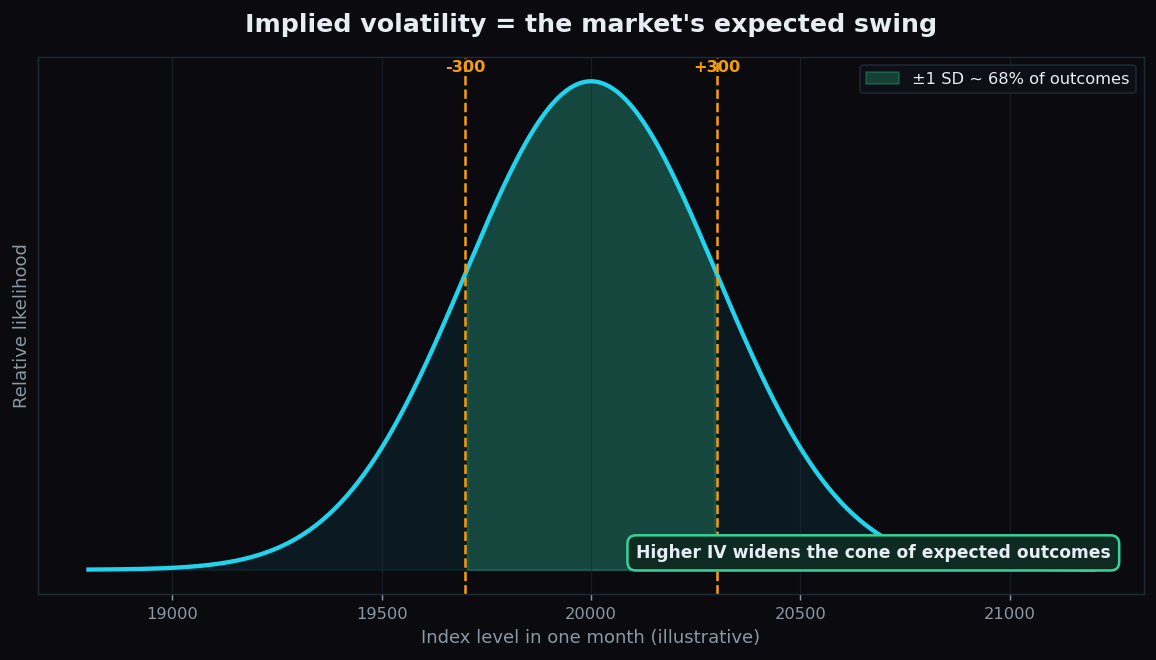
Every option price hides a forecast. Buried inside that premium is a number that tells you how big a swing the market is bracing for — not what already happened, but what might. That number is implied volatility, usually shortened to IV. Learn to read it and an option chain stops looking like a wall of prices and starts looking like a map of the market’s expectations.
What implied volatility actually is
Start with plain volatility: a measure of how much a price bounces around, expressed as a percentage. A calm, slow-moving index has low volatility; a jumpy one has high volatility. By convention it is annualised — stated as a yearly figure even when we care about a single day or week.
There are two flavours, and the difference is the whole point of this article:
- Realised (or historical) volatility — how much the underlying actually moved over some past window. It is a fact, measured after the event.
- Implied volatility — how much the market expects the underlying to move in the future. It is a forecast, and it is implied by current option prices.
Here is the clever part. We can observe an option’s premium in the market. Pricing models link that premium to a set of inputs — price, strike, time, interest, and volatility. Every input is known except volatility. So we run the model backwards: which volatility figure, fed in, reproduces the price we see? That answer is the implied volatility. It is the market’s collective expectation, reverse-engineered out of the option’s price.
The weather-forecast analogy
Realised volatility is yesterday’s rainfall — a measured fact you can look up. Implied volatility is tomorrow’s forecast — a probability the market is pricing in right now. When a big storm is expected, umbrella prices (option premiums) rise even though not a drop has fallen. When the forecast is calm, premiums sag. IV is the forecast embedded in the price of the umbrella.
The expected move: turning IV into a range
IV is most useful when you convert it into an expected move — a rough range the market is pricing for a given period. Picture the outcomes as a bell curve centred on today’s price. IV sets the width of that bell. Higher IV, wider bell; lower IV, narrower bell. As a rule of thumb, the underlying is expected to stay within one standard deviation of today’s price about 68% of the time, and within two standard deviations about 95% of the time.
We cover the arithmetic in detail in our guide to the expected move and the daily range; the key idea is that IV is not an abstract percentage — it translates directly into how wide a swing the market is paying up for.
A worked example with round numbers
Suppose an index sits at 20,000 and a one-month option implies an expected move of about 300 points (one standard deviation) over that month. Reading the bell curve:
- Roughly 68% of the time, the index is expected to finish between 19,700 and 20,300.
- Roughly 95% of the time, between 19,400 and 20,600 (two standard deviations).
Now say nervousness rises before a big announcement and IV climbs, widening the expected move to 450 points. The same 68% band stretches to 19,550 to 20,450. Nothing about the index has changed — only the market’s expectation of how far it might travel. Every option premium widens to reflect that bigger expected swing. This is exactly the vega effect, seen from the IV side.
Implied versus realised: the gap that pays
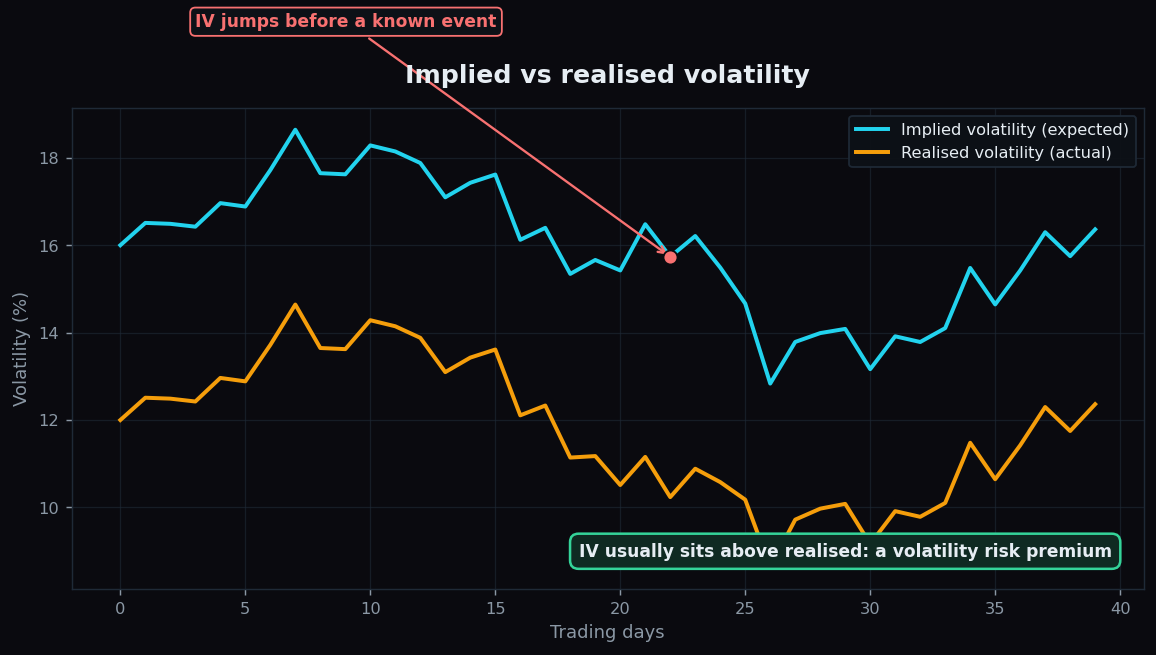
Plot implied and realised volatility side by side and a pattern usually emerges: implied tends to sit above realised. Markets, on average, pay a little extra for protection against surprises — a “volatility risk premium”. The gap is not constant, though. Notice how IV in the chart spikes before a known event and then deflates once the uncertainty is resolved. That build-up-and-collapse around scheduled events is one of the most reliable rhythms in options.
Two practical readings of the gap:
- IV well above realised often means options are richly priced — buyers are paying up for expected drama, which may or may not arrive.
- IV near or below realised often means options look cheap relative to how much the market has actually been moving.
This is descriptive context, not a signal to act — but it reframes the option chain as a tug-of-war between what the market expects and what actually unfolds.
Why implied volatility matters
- It prices every option. Two options with identical strike and expiry can carry very different premiums purely because their IV differs. Without IV, premiums look random; with it, they make sense.
- It sets the bar for buyers. Buying when IV is high means paying for a big expected move; if that move does not arrive, the premium can deflate even when direction was right — the trap detailed in why an option can lose value even when you were right.
- It reveals the market’s nerves. Rising IV broadly signals rising anxiety; falling IV signals calm. Index-wide volatility gauges are built precisely to track this mood.
The honest catch
- IV is an expectation, not a prediction of direction. It tells you how far the market might move, never which way. High IV does not mean “up” or “down” — only “possibly a lot”.
- The expected move is a probability, not a fence. The 68% band is broken often — that is what the other 32% means. Outsized moves happen, and the bell-curve model understates the truly extreme ones.
- IV changes on its own. It can rise in a quiet market or fall during a move, driven by demand for options rather than by price action alone. It is a living number, not a fixed property of the underlying.
- “High” and “low” are relative. An IV of 20% might be high for one index and low for another. It is read against that instrument’s own history, not as an absolute.
Want to see how implied volatility and option positioning shift around events — explained for learners rather than insiders? TrueTrend turns the option chain and volatility picture into plain-English context. Create a free TrueTrend account to keep learning.
Key takeaways
- Implied volatility = the market’s expected swing, reverse-engineered out of option prices.
- Realised volatility is what actually happened; implied is the forecast baked into today’s premiums.
- IV converts into an expected move: about 68% of outcomes within one standard deviation, 95% within two.
- Implied usually sits above realised (a volatility risk premium) and tends to spike before events, then deflate.
- IV measures how far, never which way — and the expected-move band is a probability, not a guarantee.
See these concepts on live market data — free
Create a free TrueTrend account to watch daily support/resistance levels, market regime, and option-positioning charts on NIFTY, BankNifty and 12 more instruments. Every level we publish is scored on a public scoreboard — misses included. No card required.
Free forever tier · daily levels with published hit-rates across every instrument. Descriptive market structure, not investment advice.
Not ready for an account? Get the daily levels by email.
One short email each market day — the indices' call wall, put wall, gamma flip and max pain, and how the last session's levels scored. Free, no account, unsubscribe anytime.
Descriptive market structure, not investment advice. We never share your email.