The Protective Put Explained (Illustrative Example)
If a covered call is like renting out an option on something you own, a protective put is like buying insurance on it. You keep your shares, and you separately buy a put option that pays off if the price falls. It costs money upfront, exactly like an insurance premium, and in return it puts a floor under how much you can lose. This article explains the mechanics with round numbers. It is an illustrative example to explain how the structure works — not a recommendation, and not a trade to place.
What a protective put actually is
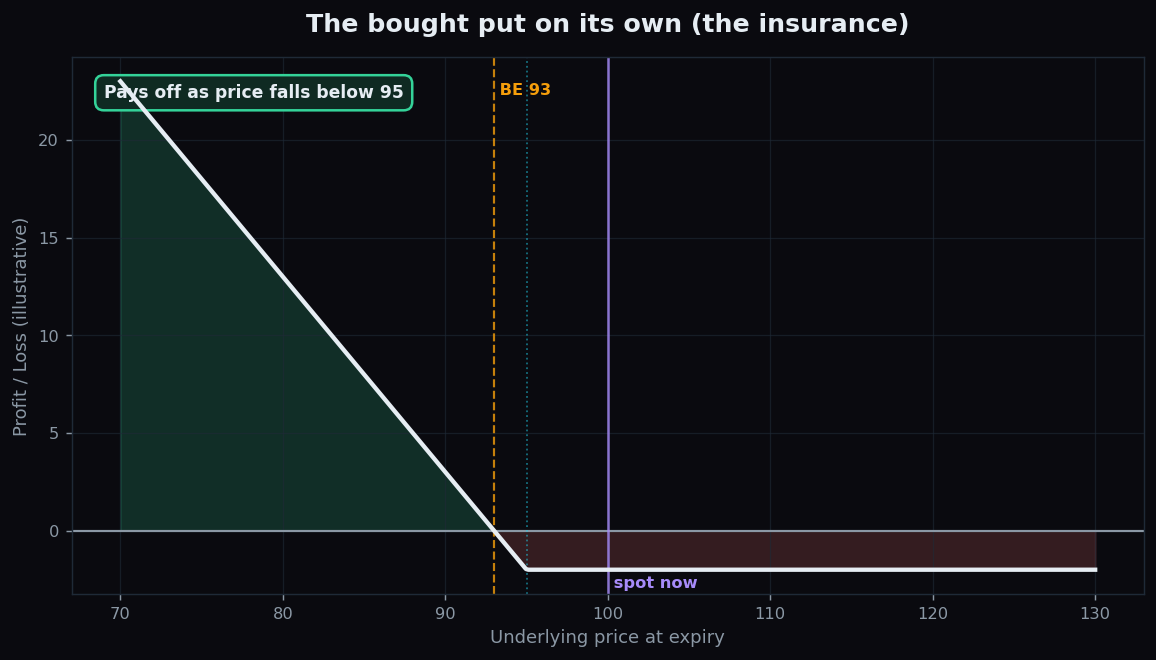
A put option is a contract that gives its buyer the right to sell a stock at a fixed price (the strike) before expiry. As the price drops further below the strike, the put becomes worth more, because the right to sell high while the market is low is valuable. The buyer pays a premium upfront for this right.
A protective put simply means you own shares and buy a put against them at the same time. The put acts as a safety net. No matter how far the stock falls, you hold the right to sell at the strike, so your loss stops there. Your upside, meanwhile, stays open — if the stock rises, you still enjoy the gains, minus the small premium you paid for the insurance.
The insurance analogy is almost exact. You insure a car for a yearly premium. If nothing happens, the premium is simply a cost you accept for peace of mind. If there is a crash, the policy pays out and caps your loss. You would never say the premium was “wasted” in a safe year — that is just what protection costs.
A worked example with round numbers
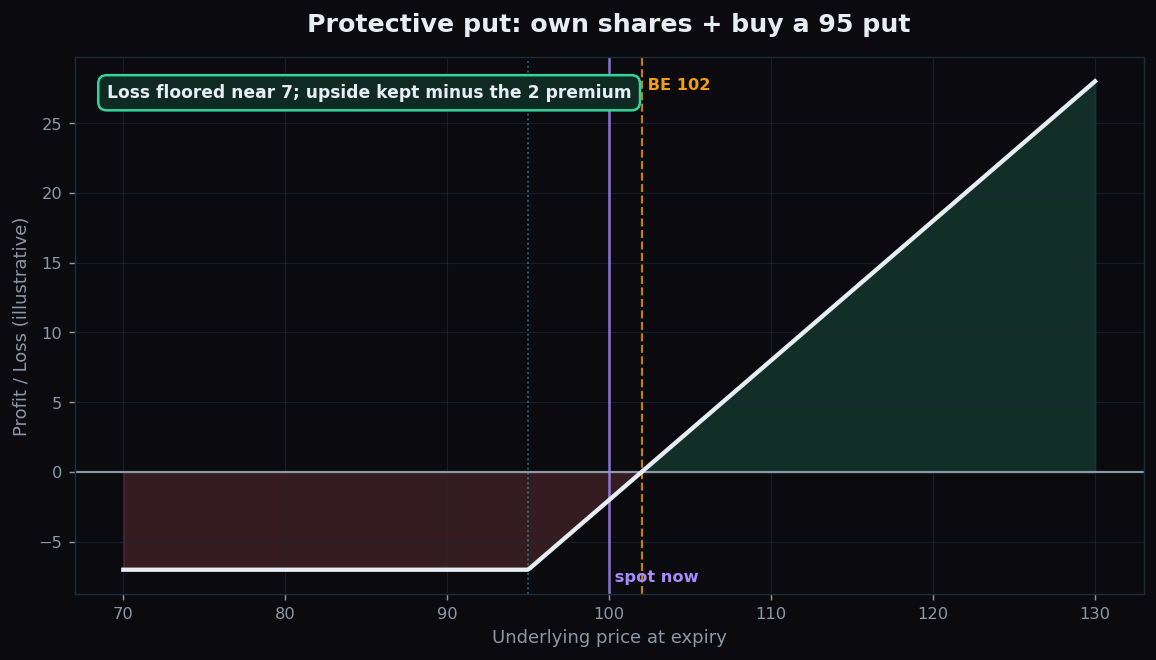
Suppose you own 1 lot of a stock at 100 and you buy a put with a strike of 95 for a premium of 2. Consider expiry:
- Stock rises to 120. The put expires worthless — you had no need to sell at 95. Your shares are up 20, and you paid 2 for the insurance, so your net gain is 18. The put simply expired, like an unused policy.
- Stock stays at 100. The put expires worthless. You are down only the 2 premium.
- Stock falls to 80. Without the put you would be down 20. But your put lets you sell at 95, so your loss on the shares stops at 5 (from 100 to 95), plus the 2 premium — a total loss of just 7, no matter how much further the stock drops.
So the maximum loss is capped at 7 (reached at 95 and below), the breakeven on the upside is 102 (your 100 entry plus the 2 premium), and the upside above that is unlimited, just reduced by the 2 you spent.
Why people study it
The protective put is the textbook example of defined-risk ownership. It answers a very human question: “How can I stay invested for the upside but know, in advance, the very worst that can happen to me?” The answer is that you pay a known premium today to convert an open-ended downside into a fixed, floored one.
It is the natural mirror image of the covered call. A covered call sells away upside to collect cash; a protective put spends cash to buy away downside. The two charts below show the pieces. The first is the combined position. The second is the bought put on its own — the insurance leg that creates the floor.
The honest catch: what can go wrong
Insurance is never free, and a protective put has real drawbacks worth stating plainly:
- It costs money every time. The 2 premium is a drag on returns. Buy puts repeatedly over a calm year and the premiums add up, quietly eating into gains that never needed protecting.
- Protection expires. A put only covers you until its expiry date. After that, you are exposed again unless you buy a new one — and rolling protection forward has a recurring cost.
- Premiums spike exactly when you want cover. When fear rises, puts get more expensive, because implied volatility climbs. Insuring during a storm costs more — see how implied volatility affects option prices.
- There is still a loss. The floor is below your entry. In the example you can still lose 7. A protective put limits the damage; it does not eliminate it.
The strike you choose also matters. A higher strike gives a tighter floor but costs more premium; a lower strike is cheaper but lets you fall further before it kicks in. That trade-off between cost and coverage is the whole art of the structure.
Before weighing any hedge, it helps to understand the daily range a stock is priced to move and where option activity is clustered. TrueTrend translates raw derivatives data into clear, plain-English context. Explore TrueTrend free and learn to read market structure before structures.
Key takeaways
- A protective put is owning shares and buying a put against them as downside insurance.
- In the example: own at 100, buy the 95 put for 2 → max loss 7, upside breakeven 102, gains above that stay open.
- It converts an open-ended downside into a known, floored one — the mirror image of a covered call.
- The catch: the premium is a recurring cost, protection expires, and it gets pricey exactly when fear is high.
- This is an educational illustration of the mechanics, with made-up numbers — not advice and not a trade to place.
See these concepts on live market data — free
Create a free TrueTrend account to watch daily support/resistance levels, market regime, and option-positioning charts on NIFTY, BankNifty and 12 more instruments. Every level we publish is scored on a public scoreboard — misses included. No card required.
Free forever tier · daily levels with published hit-rates across every instrument. Descriptive market structure, not investment advice.
Not ready for an account? Get the daily levels by email.
One short email each market day — the indices' call wall, put wall, gamma flip and max pain, and how the last session's levels scored. Free, no account, unsubscribe anytime.
Descriptive market structure, not investment advice. We never share your email.