RBI Repo Rate: How Rate Decisions Move Indian Markets
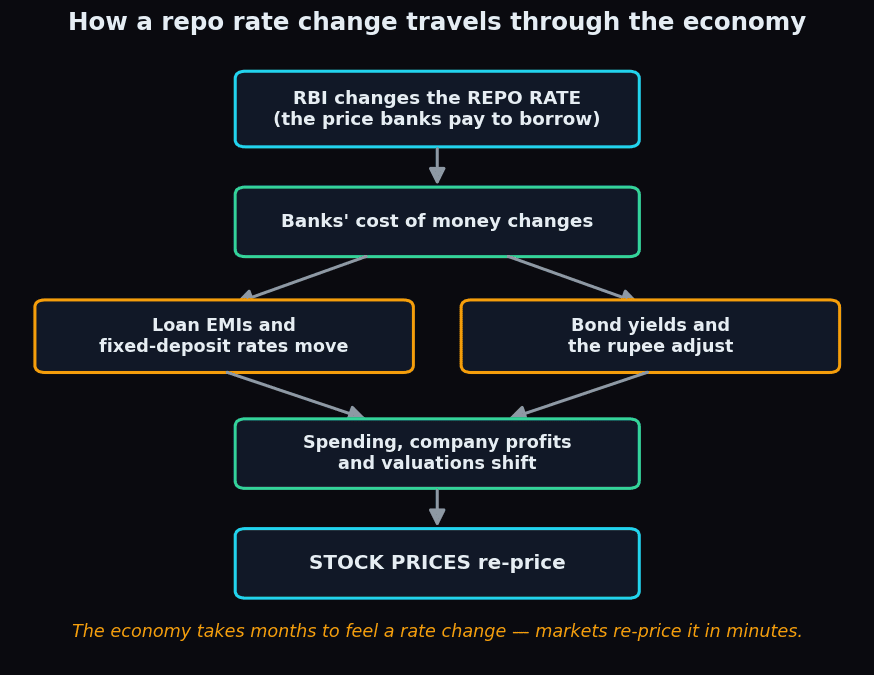
Roughly six times a year, on a scheduled morning, the Governor of the Reserve Bank of India (RBI) reads out a short statement. Within seconds, Nifty, Bank Nifty, bond prices and the rupee all react. At the centre of that statement sits one number: the repo rate. This post explains what that number is, who sets it, and why a change of just a quarter of a percent — or sometimes no change at all — can jolt the whole market.
What the repo rate actually is
The repo rate (short for repurchase rate) is the interest rate at which the RBI lends short-term money to commercial banks, with government bonds pledged as security. In plain words, it is the wholesale price of money in India.
Think of onions at a wholesale mandi. If the mandi price of onions goes up, every local sabziwala quietly raises the price at your doorstep, because their own cost went up. Money works the same way. Banks "buy" money at a cost anchored to the repo rate and "sell" it onward as home loans, car loans and business loans. When the RBI moves the wholesale price, the retail prices — your loan rate, your fixed-deposit (FD) rate — follow. Since October 2019, banks have been required to link new floating-rate retail loans to an external benchmark, and the most common benchmark chosen is the repo rate itself. That is why a repo change now shows up in home-loan EMIs within months rather than years.
Who decides, and how often
The rate is set by the Monetary Policy Committee (MPC), a six-member panel created in 2016: three RBI officials, including the Governor, and three external experts appointed by the government. They vote, the majority wins, and the Governor holds a casting vote in a tie. The committee normally meets every two months — about six scheduled meetings a year.
The MPC is not trying to please the stock market. Its legal mandate is to keep consumer price inflation (CPI — the rate at which everyday prices rise) around 4%, inside a tolerance band of 2% to 6%, while supporting growth. Broadly: inflation running hot → raise rates to cool borrowing and spending; inflation well-behaved and growth weak → cut rates to encourage them. Rate moves are usually announced in steps of 25 basis points — a basis point is one-hundredth of a percentage point, so 25 basis points means 0.25%.
Alongside the number, the RBI also announces a stance (words like "accommodative" or "neutral" that hint at the direction of future moves) and updates its inflation and growth forecasts. Markets read these words as carefully as the rate itself.
A worked example: what one percent really means
Take a home loan of ₹50 lakh for 20 years. At an interest rate of 8%, the EMI (equated monthly instalment — the fixed amount paid every month) works out to about ₹41,800. Raise the rate to 9% and the EMI becomes about ₹45,000.
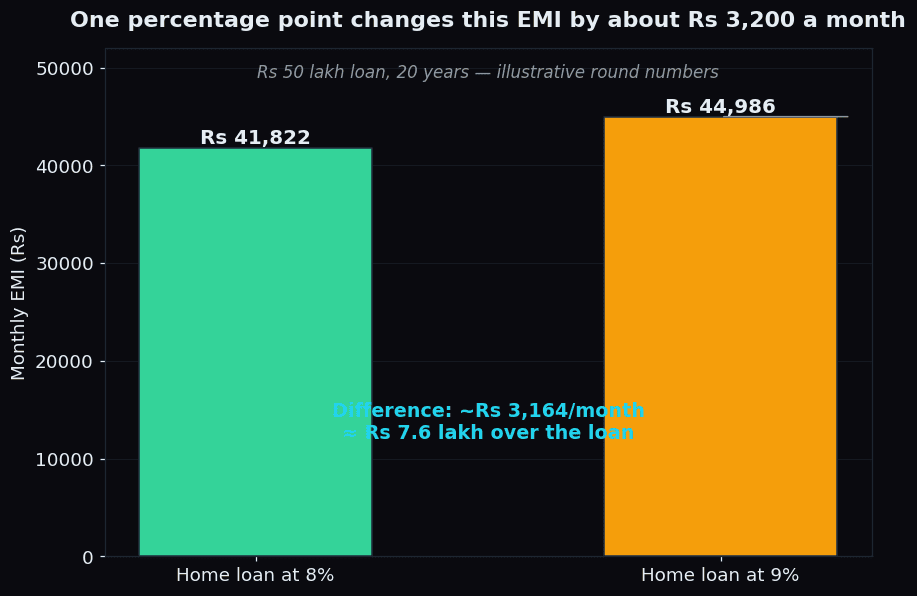
That single percentage point costs the borrower roughly ₹3,200 extra every month — close to ₹7.6 lakh over the life of the loan. Multiply that across crores of borrowers and lakhs of companies with loans of their own, and you can see why rates matter: they decide how much spending money households have left, and how much profit companies keep after paying interest.
How a rate change travels to stock prices
Economists call this chain transmission. It runs through four main channels:
- EMIs and spending. Cheaper loans leave households with more money and make big purchases — homes, cars — easier to finance. Costlier loans do the opposite.
- Company profits. Most companies borrow. When interest costs fall, more of each rupee of sales survives as profit; when they rise, less does.
- Valuations. When an FD earns more, future company profits look relatively less attractive today, so investors pay less for the same earnings. Lower rates flip that logic, which is one reason rates and stock valuations tend to pull in opposite directions.
- Bonds and the rupee. Bond yields adjust to the expected path of policy, and — other things equal — the gap between Indian and US rates influences foreign investor flows and the rupee.
The strange part is the timing. The real economy takes months, sometimes a year, to feel a rate change. The stock market does not wait — it re-prices the expected future within minutes of the announcement.
Why markets sometimes fall on a rate cut
Here is the trap most newcomers fall into: assuming cut = rally, hike = fall. In practice, the market has usually formed a view long before the meeting — that view is said to be priced in, meaning current prices already assume it. What moves prices on the day is the gap between expectation and outcome.
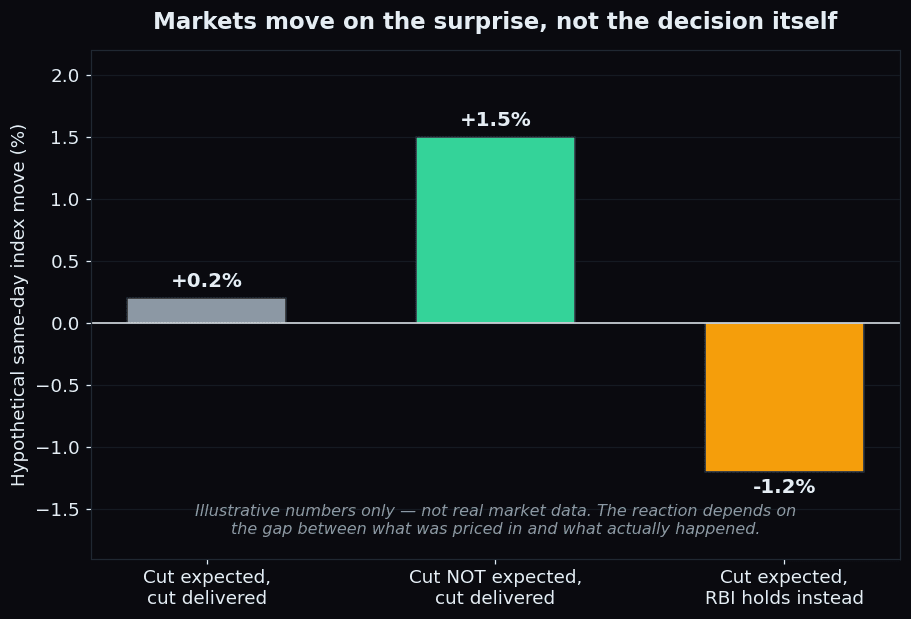
If everyone expected a cut and the cut arrives, little may happen — the good news was already in the price. If a cut arrives that nobody expected, the market can jump. And if an expected cut does not arrive, the market can fall even though nothing was "tightened". The commentary matters too: a cut delivered alongside a worried inflation forecast can disappoint, while a hold with dovish language (hinting at future cuts) can cheer markets up.
Key takeaway: a rate decision moves markets only to the extent that it differs from what was already expected. The same 25-basis-point cut can be a damp squib or a firecracker depending on what was priced in.
Which parts of the market feel it first
- Banks and NBFCs. Their raw material is money, so rate changes hit their funding costs, lending margins and loan demand directly. This is a big reason Bank Nifty is often the most animated index on policy day.
- Autos and real estate. Most cars and homes in India are bought on EMIs, so these sectors are unusually sensitive to loan rates.
- The broad market. Valuation maths applies to every stock, but export-driven sectors such as IT respond more to global rates and currency moves than to the RBI alone. How inflation itself feeds through to equities is a related but separate story.
The honest catch
- Nobody reliably predicts the MPC. Polls of economists regularly miss, and split votes inside the committee happen. Treat every confident pre-policy forecast with suspicion.
- Policy-day moves are noisy. The first reaction often reverses within hours as the market digests the Governor's full statement and press conference. A green first candle is not a verdict.
- Transmission is slow and uneven. Deposit and lending rates adjust with a lag, so the economic effect of a decision arrives quarters later, long after the headlines have moved on.
- Levels change; the mechanism does not. The repo rate sat at 6.50% for two full years between February 2023 and February 2025, then was cut in steps during 2025. Whatever the number is when you read this — the latest is always on rbi.org.in — the machinery described above works the same way.
None of this tells you what to do on policy day — and that is the point. The repo rate is context, not a signal. Understanding the machinery simply stops you from misreading the market's reaction to it.
Policy days are exactly when market positioning gets noisy and hard to read. TrueTrend turns that structure — across Nifty, Bank Nifty and F&O — into one clear, at-a-glance read, and scores its own track record in public instead of selling predictions. Create a free account and see the day's positioning for yourself.
See these concepts on live market data — free
Create a free TrueTrend account to watch daily support/resistance levels, market regime, and option-positioning charts on NIFTY, BankNifty and 12 more instruments. Every level we publish is scored on a public scoreboard — misses included. No card required.
Free forever tier · daily levels with published hit-rates across every instrument. Descriptive market structure, not investment advice.
Not ready for an account? Get the daily levels by email.
One short email each market day — the indices' call wall, put wall, gamma flip and max pain, and how the last session's levels scored. Free, no account, unsubscribe anytime.
Descriptive market structure, not investment advice. We never share your email.