Support and Resistance vs Option Walls: The Numbers
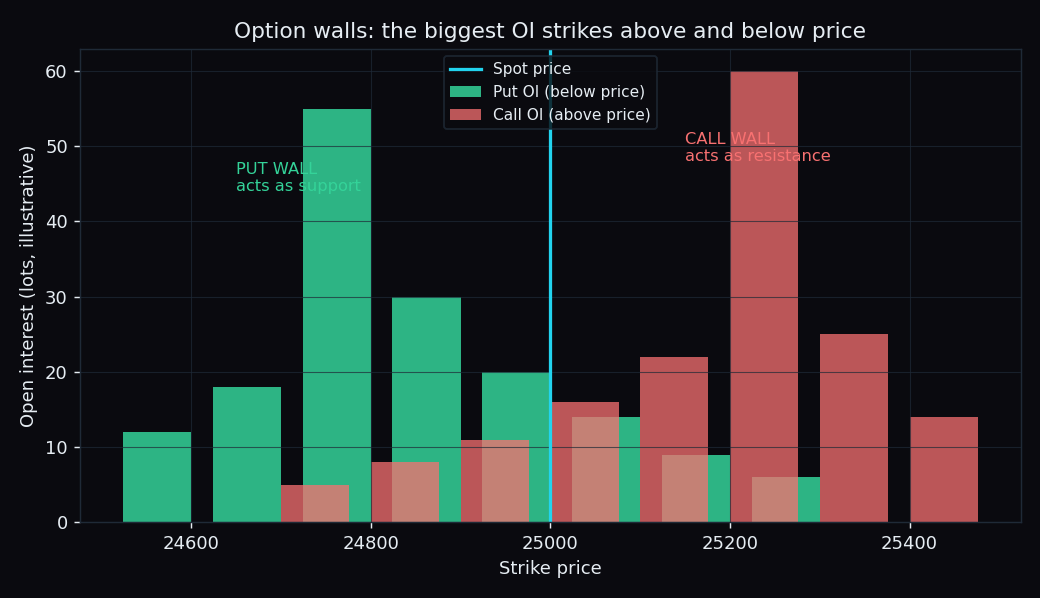
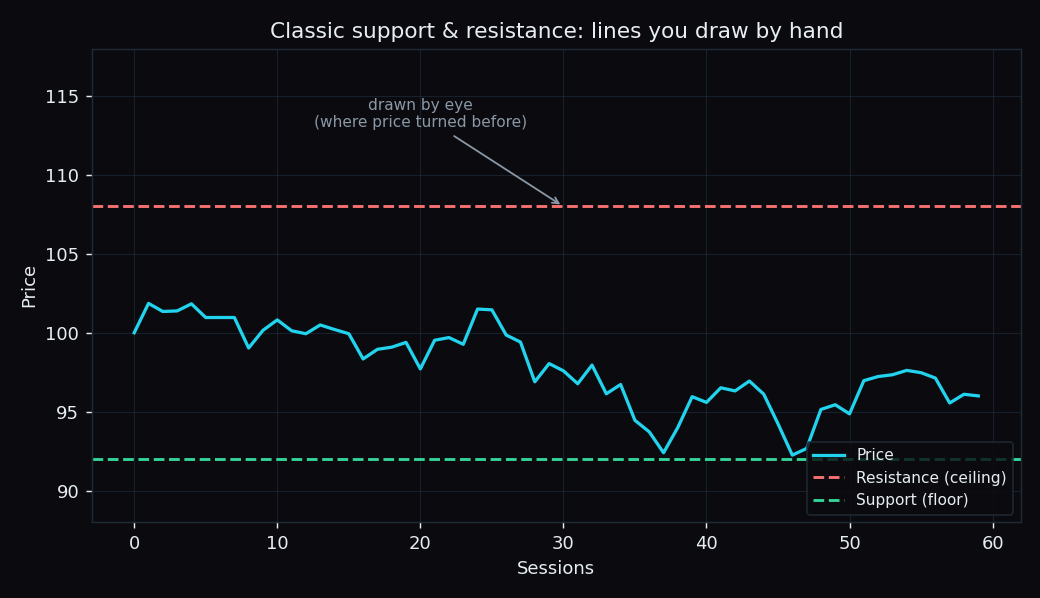
Two lines on a chart claim to mark the same thing: a level price should struggle to cross. One is support and resistance — a line a trader draws by eye where price turned before. The other is an option wall — a strike where real money is parked in the options market. They look similar on a screen, but only one of them can be measured honestly. So we measured it.
What support and resistance actually is
Support is a price floor where buyers have stepped in before, so price tends to bounce up off it. Resistance is a ceiling where sellers have shown up, so price tends to stall and turn down. Think of it like a high-water mark you draw on a wall after a flood: it tells you where the water reached last time, not where it must stop next time.
The catch is that these lines are subjective. Give the same chart to ten traders and you will get ten slightly different levels, because each person picks which past turns to trust. There is no public scoreboard for "did this hand-drawn line hold." If you want the basics first, see our explainer on support and resistance.
What an option wall is
An option wall is a strike price where a very large amount of open interest (the number of live option contracts) has built up. A put wall sits below the current price and behaves like support. A call wall sits above the current price and behaves like resistance.
Here is the difference that matters: an option wall is not drawn by eye. It is a number you can read straight off the option chain. If the 24,800 put strike has the most open interest below spot, that is the put wall — no judgement call. The people who sold those options have a real incentive to defend the level, which is the mechanical reason a wall can act like a floor or a ceiling.
The everyday version: support and resistance is a chalk line you draw where the crowd stood last time. An option wall is the crowd actually standing at a specific door, right now, with money on the line.
A worked example
Say Nifty is trading at 25,000. You look at the option chain and see the heaviest put open interest at the 24,800 strike and the heaviest call open interest at 25,200. That gives you a put wall at 24,800 (support-like) and a call wall at 25,200 (resistance-like). The 400-point band between them is where the options market is most heavily positioned for price to stay. Nobody drew those lines — they are just the two biggest piles of open interest.
What "holding" means — and how we score it
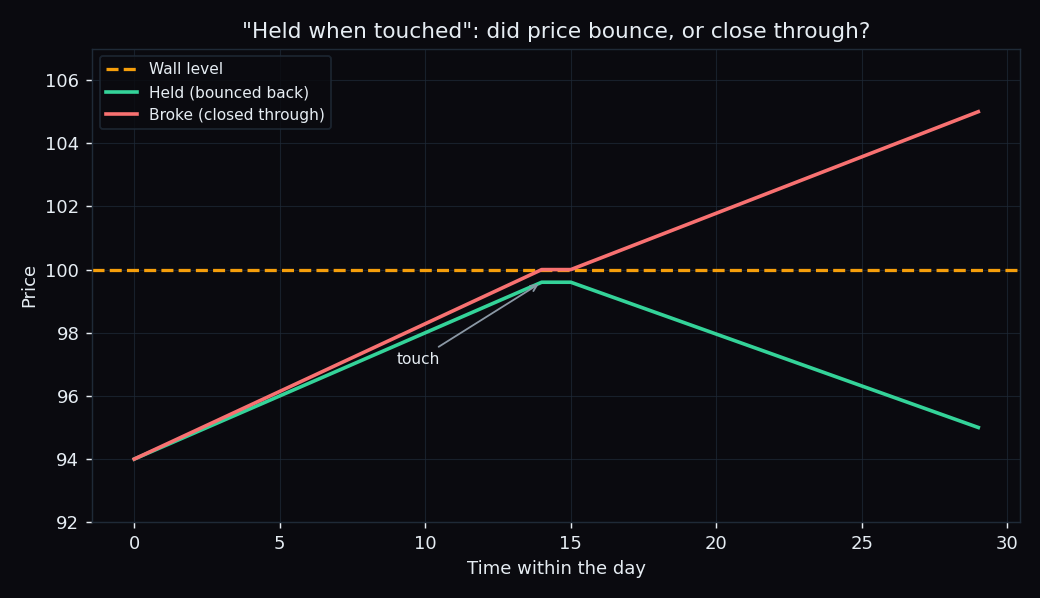
To compare fairly, you need one clear rule. Ours is simple: we only count a wall on a day price actually touches it (a "touch"), and we ask whether price held — bounced away and closed on the same side — or broke and closed through. A level nobody tested tells you nothing, so it does not count.
By the numbers
Here is what the walls did on the days price actually reached them, measured across roughly 57 recent sessions for each index. Every figure below shows its sample size (n = number of touches), because a hit-rate without a sample size is just a slogan.
- Nifty put wall: held 72% of the time it was touched (n=18).
- Nifty call wall: held 73% of the time it was touched (n=15).
- Bank Nifty put wall: held 75% of the time it was touched (n=12).
- Bank Nifty call wall: held just 29% of the time it was touched (n=7).
Three of the four walls held roughly three times out of four when tested — a real, repeatable tendency, not a coin flip. That is the honest edge of a measurable level over a hand-drawn one: you can put a number on it and check the number in public. For the fuller breakdown, see do option walls hold.
The honest catch
Look again at that last line. The Bank Nifty call wall held only 29% of the time — but on just 7 touches. Seven is a tiny sample: one or two different days would swing that number wildly, so treat it as "we don't know yet," not "the call wall is weak." This is exactly why sample size sits next to every figure.
Two more limits worth stating plainly. First, a wall can move: heavy option positions get rolled to new strikes as expiry approaches, so today's wall may not be tomorrow's. Second, "held when touched" is a tendency, not a promise — roughly one touch in four still broke through, and the whole point of a level is that it eventually fails. An option wall is a better-measured line than a hand-drawn one; it is not a guarantee, and nothing here is a call to trade any strike.
The reason we can even show you these hit-rates is that TrueTrend reads the live put wall, call wall and other positioning levels off the option chain for Nifty, Bank Nifty and F&O, and scores how they behave in public. If you would rather see the wall than draw a line by hand, start with TrueTrend.
See these concepts on live market data — free
Create a free TrueTrend account to watch daily support/resistance levels, market regime, and option-positioning charts on NIFTY, BankNifty and 12 more instruments. Every level we publish is scored on a public scoreboard — misses included. No card required.
Free forever tier · daily levels with published hit-rates across every instrument. Descriptive market structure, not investment advice.
Not ready for an account? Get the daily levels by email.
One short email each market day — the indices' call wall, put wall, gamma flip and max pain, and how the last session's levels scored. Free, no account, unsubscribe anytime.
Descriptive market structure, not investment advice. We never share your email.