Survivorship Bias: Why Trading-Guru Track Records Mislead You
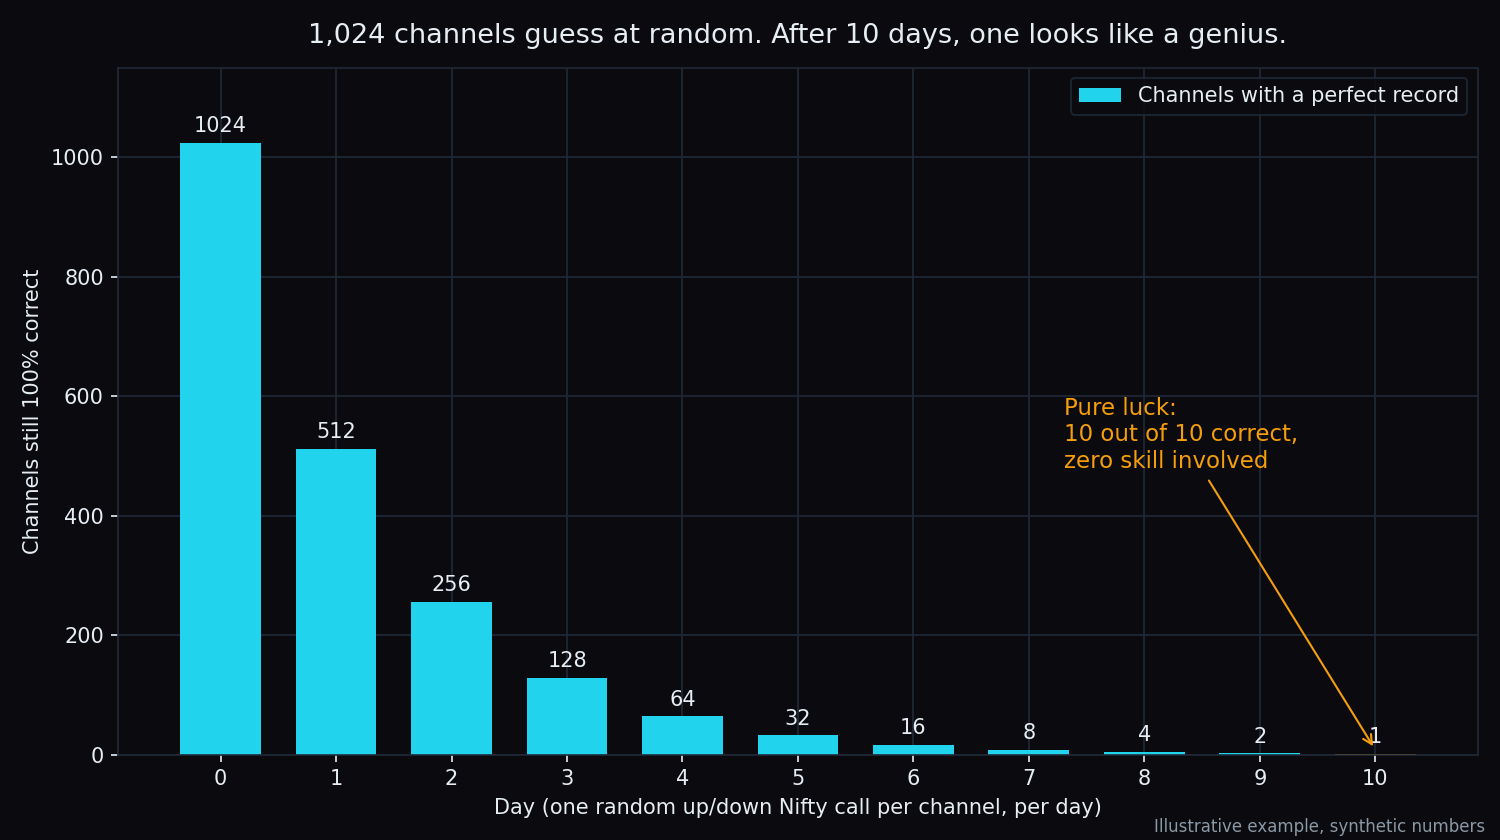
Imagine 1,024 new Telegram channels. Each one posts a single call every morning: “Nifty closes up today” or “Nifty closes down today” — chosen by flipping a coin. After ten trading days, simple arithmetic says that, on average, one channel will have been right ten days in a row. It has no skill at all. But its screenshots look like genius, and that is the channel people end up hearing about.
This is survivorship bias, and it quietly shapes almost every trading track record you see online. This post explains what it is, walks through the maths with round numbers, and ends with a short checklist for reading any record — including ours.
What is survivorship bias?
Survivorship bias is the mistake of judging a group only by the members that are still around, while forgetting the ones that dropped out. Because the ones that dropped out are usually the failures, the group looks far better than it really was.
An everyday analogy: you walk past a street of restaurants and every one of them is busy. “Opening a restaurant must be easy money,” you think. What you cannot see are the restaurants that used to be on that street and closed. They are not there to argue with you. The street is not showing you the odds — it is showing you the winners of the odds.
Trading is the same street. The channels, courses and profiles that lost money mostly go quiet, rename themselves or disappear. The ones left standing are, by definition, the ones whose run of results happened to look good.
Worked example 1: the coin-flip genius
Go back to our 1,024 channels. Each call is a coin flip, so on any day roughly half are right.
- After day 1: about 512 channels are still 100% correct.
- After day 2: about 256.
- After day 5: about 32.
- After day 10: about 1.
Every day the “perfect” group halves. Ten halvings of 1,024 leaves one. That single survivor can honestly post “10 out of 10 correct.” Nothing in the screenshots is fake. What is missing is the other 1,023 channels.
The chance that any one particular channel pulls this off is 1 in 1,024 — under 0.1%. But the chance that at least one channel in a crowd of 1,024 pulls it off is about 63%. When you meet the lucky one, you are seeing the rare outcome, not the typical one. And there are far more than 1,024 people posting market calls in India.
Worked example 2: the missing losers change the average
Survivorship bias does not only create one fake star. It also inflates the average result of a whole group.
Say ten channels start the year, each running a model portfolio. By December, four have lost badly and shut down. Here is how the full group did:
- Still online (6 channels): +25%, +18%, +12%, +8%, +5%, +2%. Average: about +11.7%.
- Shut down (4 channels): −20%, −30%, −35%, −45%.
- All ten that started: total of +70 and −130 = −60, divided by 10 = an average of −6%.
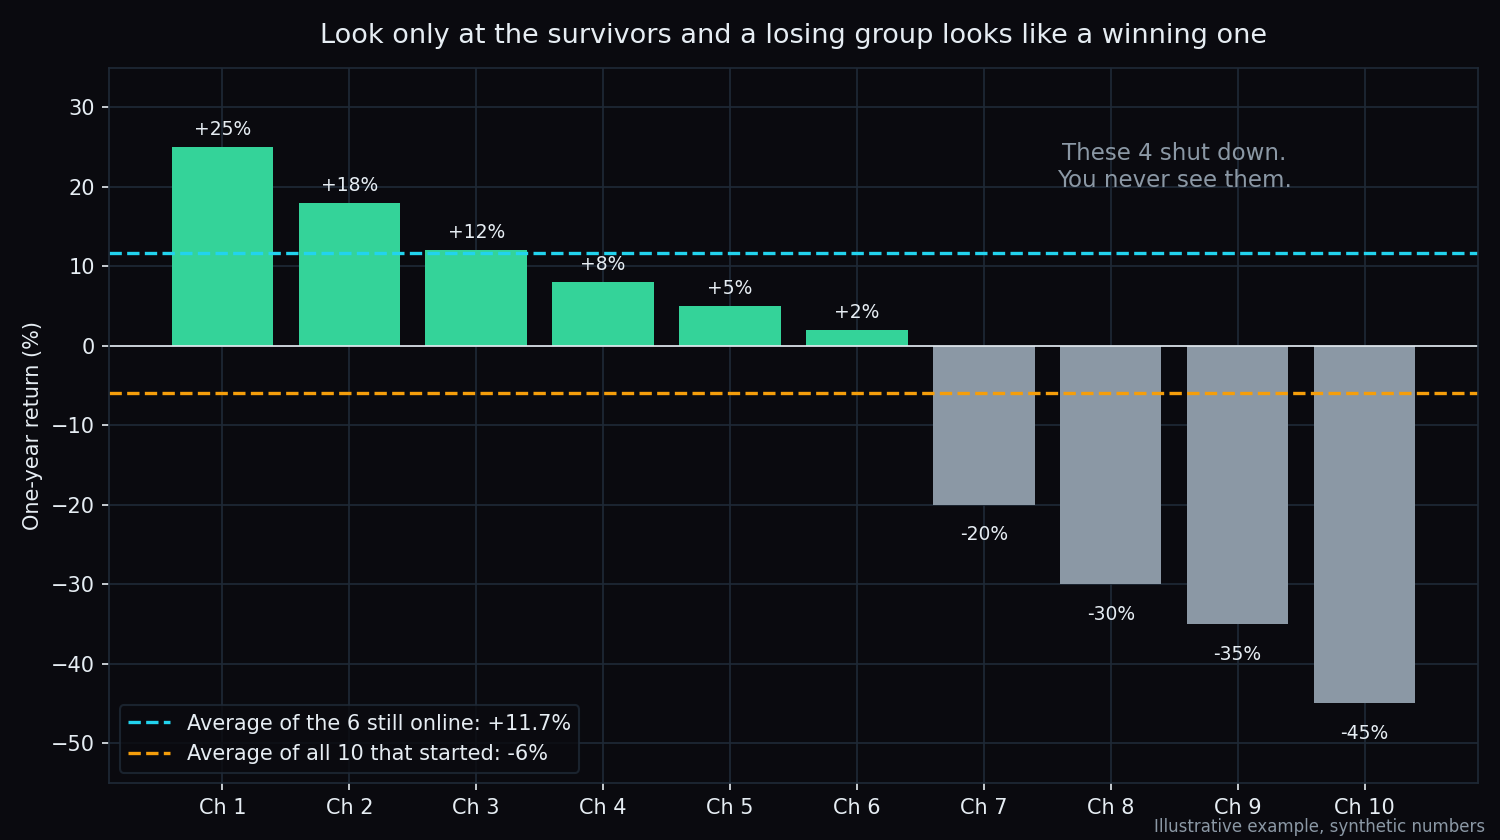
A reader who only sees the six survivors concludes that “following these channels makes about 12% a year.” The truth for someone who picked a channel at random in January is a loss of 6%. Same group, opposite conclusion — and the only difference is who is still around to be counted.
This is not just a thought experiment. SEBI’s own study of individual F&O traders (published September 2024, covering FY22 to FY24) found that about 93% of them made net losses. When the vast majority lose, the confident winners you see online are a small, self-selected slice — exactly the setup where survivorship bias does the most damage.
The smaller cousin: the highlight reel
Even a single person can create survivorship bias inside their own record. It happens when only the calls that worked get posted, pinned or reshared, and the rest are quietly deleted or never mentioned.
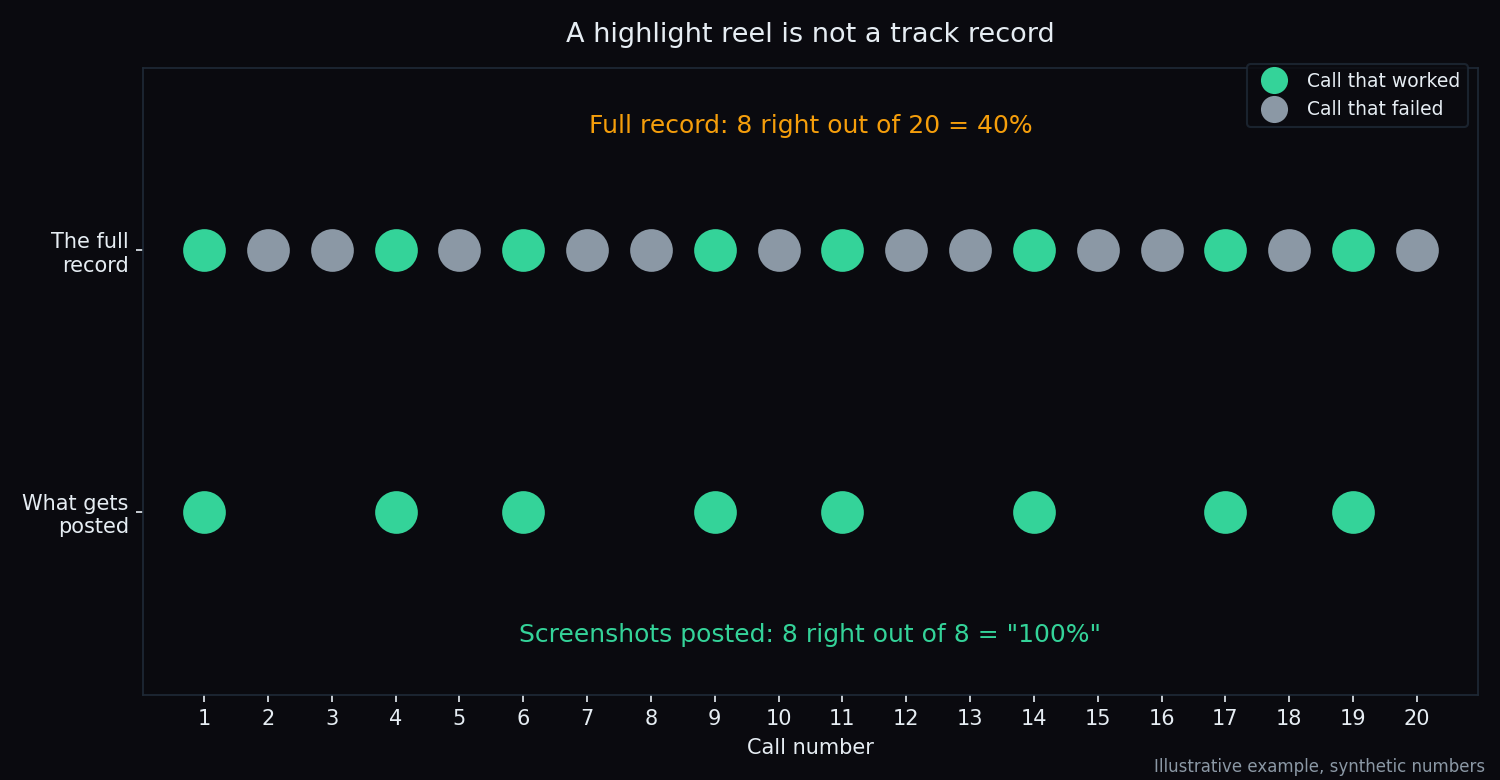
In the example above, the full record is 8 right out of 20 — a hit rate (the share of calls that worked) of 40%. The screenshot feed shows 8 out of 8. Nobody lied about any single trade. The bias comes entirely from what was left out.
The honest takeaway: a track record tells you something only if you can see the whole thing — every call, including the misses, from a starting date that was fixed before the results came in. A record assembled after the fact is a highlight reel, however real each screenshot is.
Small samples make luck look like skill
Survivorship bias has a partner: tiny sample sizes. The sample size, written n, is simply how many cases a number is based on. The smaller n is, the easier it is for luck alone to produce a perfect-looking score.
Our own public Scoreboard shows this clearly, which is why it prints n next to every figure. As of 14 September 2026:
- The Axis Bank call wall held 100% of the time when touched — but on just n=4 touches. Four in a row is nowhere near enough to call anything reliable.
- The Nifty 50 call wall held 76% of the time (n=21) and the put wall 62% (n=32). Less dramatic, but based on far more cases.
- For Bank Nifty, the call wall held 64% (n=14) and the put wall 67% (n=15).
(A call wall or put wall is the option strike with the heaviest open interest — the number of option contracts still open — above or below the price. “Held” means price came up to it during the session and turned back instead of breaking clearly through. The full definitions are in do option walls hold?.)
Notice that a 100% figure on four cases is weaker evidence than a 62% figure on thirty-two. A guru who shows you “100% accuracy” without an n is showing you the Axis Bank line and hiding the denominator.
What an honest record keeps: the bad numbers
The simplest test of whether a record resists survivorship bias is whether it still shows the parts that look bad. The same Scoreboard, as of 14 September 2026, also shows:
- Infosys: call wall held 20% (n=5), put wall 20% (n=10).
- TCS: call wall held 22% (n=9), put wall 21% (n=19).
- Nifty 50 closed within one strike of max pain (the strike where option holders collectively lose the most at expiry) on only 40% of sessions (n=90).
Those numbers are not flattering. That is the point. A record that only ever contains wins has almost certainly been filtered, whether by deleting posts, dropping instruments, or restarting the count after a bad month.
Five questions to ask of any track record
- Where is the full list? Can you see every call, including the misses, or only a feed of screenshots?
- When did the count start? Was the start date fixed in advance, or chosen after a good run?
- What is n? A hit rate without a sample size is close to meaningless. Ten lucky calls in a row happen by chance more often than people expect.
- What happened to the old ones? Has the account renamed itself, deleted old channels, or quietly dropped strategies that stopped working?
- Does it include the ugly bits? Losing periods, weak instruments, costs. If nothing looks bad, ask what was removed.
The honest catch
None of this proves that every successful trader is just lucky. Some people do have real skill. The problem is that survivorship bias makes skill and luck look identical from the outside, as long as you only see the survivors. The fix is not cynicism about everyone — it is asking for the full record, with its sample size, before believing any number.
It also cuts both ways. A public scoreboard like ours measures how often certain market levels behaved a certain way in the past. It is a description of history with stated sample sizes, not a promise about tomorrow, and a figure on a small n can move a lot as new sessions are added.
If you want to go further, the maths of drawdowns shows why a few big losses — the kind that make channels vanish — matter more than a long list of small wins, and fear and greed in trading explains why a perfect-looking record is so hard to resist.
Clarity over highlight reels. TrueTrend turns option positioning into a clear, at-a-glance read across Nifty, Bank Nifty and F&O stocks — and scores its own levels in public, misses included. Create a free TrueTrend account to see the full picture.
See these concepts on live market data — free
Create a free TrueTrend account to watch daily support/resistance levels, market regime, and option-positioning charts on NIFTY, BankNifty and 12 more instruments. Every level we publish is scored on a public scoreboard — misses included. No card required.
Free forever tier · daily levels with published hit-rates across every instrument. Descriptive market structure, not investment advice.
Not ready for an account? Get the daily levels by email.
One short email each market day — the indices' call wall, put wall, gamma flip and max pain, and how the last session's levels scored. Free, no account, unsubscribe anytime.
Descriptive market structure, not investment advice. We never share your email.