Drawdown Math: Why a 50% Loss Needs a 100% Gain Back
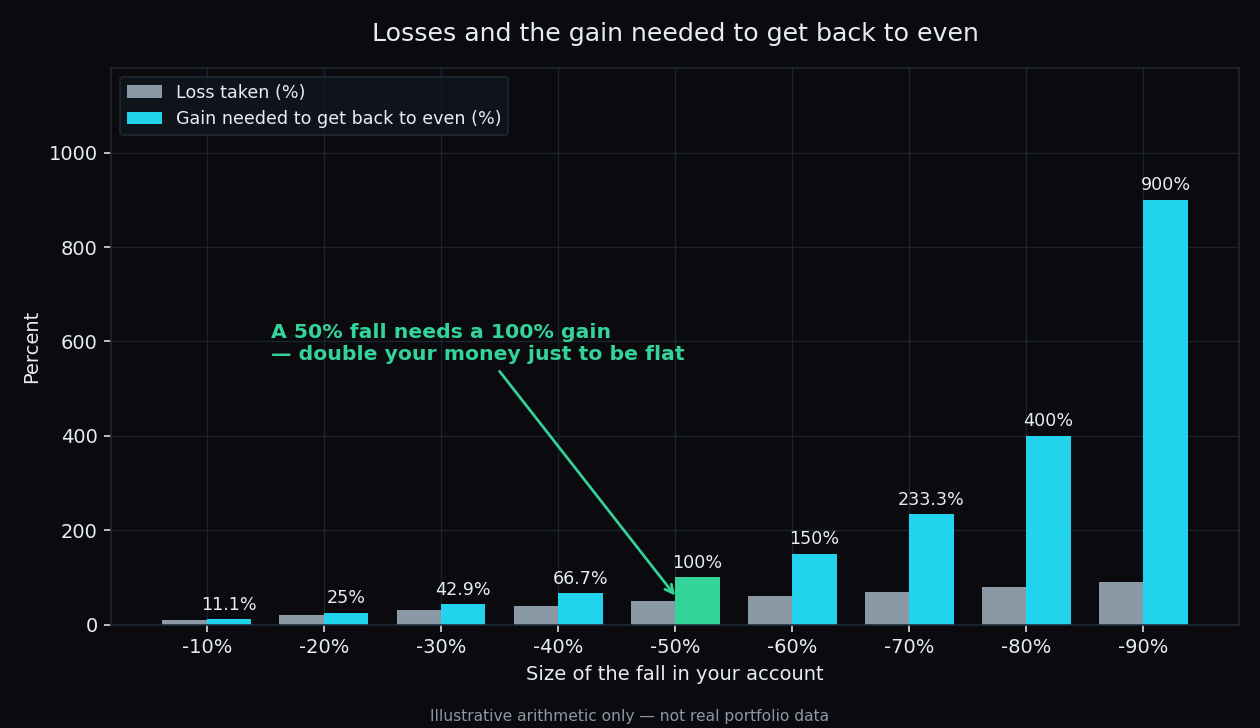
Start with ₹1,00,000. It falls by half, so you are left with ₹50,000. Now ask the obvious question: what gain gets you back to ₹1,00,000? Not 50%. You need to add ₹50,000 to a ₹50,000 account — a gain of 100%. You have to double your money just to be back where you started. That gap between the loss and the gain that undoes it is the single most useful piece of arithmetic in markets, and it is the reason experienced traders talk more about the size of their losses than the size of their wins.
First, what a drawdown is
A drawdown is simply the fall from an account's highest point to its lowest point after that. If ₹1,00,000 grows to ₹1,20,000 and then drops to ₹90,000, the drawdown is 25% — measured from the ₹1,20,000 peak, not from where you began. It is the number that describes the worst stretch you actually lived through.
The gain needed to erase a drawdown has a short formula. If the fall is d (as a decimal), the recovery required is:
Recovery needed = d ÷ (1 − d). A 20% fall: 0.20 ÷ 0.80 = 0.25, so +25%. A 50% fall: 0.50 ÷ 0.50 = 1.00, so +100%.
Written out for a range of falls, the pattern is uncomfortable:
- Lose 10% → you need +11.1% to be flat again.
- Lose 20% → you need +25%.
- Lose 30% → you need +42.9%.
- Lose 50% → you need +100%.
- Lose 70% → you need +233%.
- Lose 90% → you need +900%.
Why the two percentages never match
The answer is boring and important: the two percentages are measured on different amounts of money. The loss is calculated on the larger, pre-loss balance. The recovery has to be calculated on the smaller, post-loss balance. Same rupees, different base — so the same rupee move is a bigger percentage on the way back up.
Think of a shop. A shirt priced at ₹1,000 goes on a 50% discount, so it is now ₹500. To restore the original sticker price, the shop cannot add 50% — that only gets it to ₹750. It has to add 100%. Nobody finds this confusing at a shop counter. It becomes confusing only when the same arithmetic is applied to an account balance over several months.
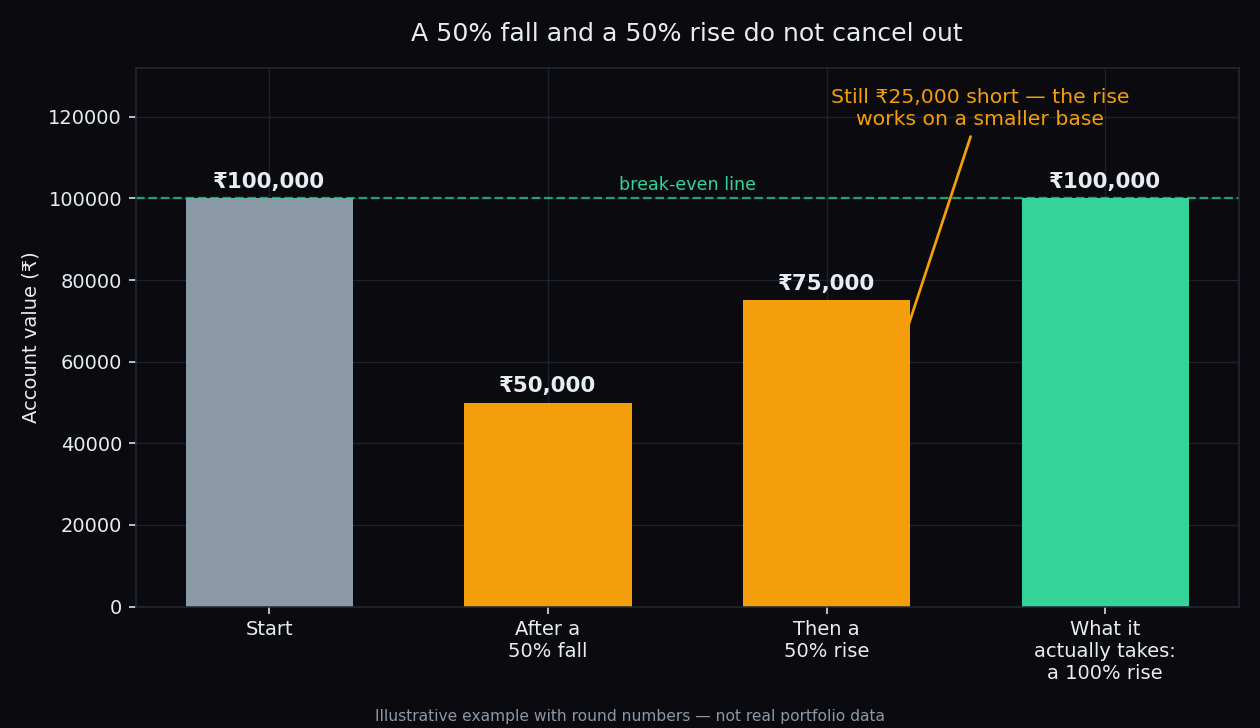
The worked example, step by step. Start at ₹1,00,000. A 50% fall takes you to ₹50,000. A 50% rise on that ₹50,000 adds ₹25,000 and leaves you at ₹75,000 — still ₹25,000 short. A fall and a rise of the same percentage do not cancel out. They never have.
The same trap works in reverse, which surprises people. Gain 50% first (₹1,00,000 → ₹1,50,000), then lose 50% (₹1,50,000 → ₹75,000). Identical result. Order does not matter; the arithmetic of percentages does. This is the flip side of the effect described in the power of compounding: compounding works on whatever base is left, and losses shrink that base.
The curve bends — and then it runs away
For small falls, recovery is almost a fair fight. A 5% dip needs 5.3% back. A 10% dip needs 11.1%. Barely a difference, and easily made up in a decent month.
Past roughly a third, the curve starts to lift off. Past half, it goes near-vertical. A 75% fall requires a 300% gain — the account has to quadruple. A 90% fall requires 900%. This is why a deep drawdown is not "a bad patch times three"; it is a different category of problem.
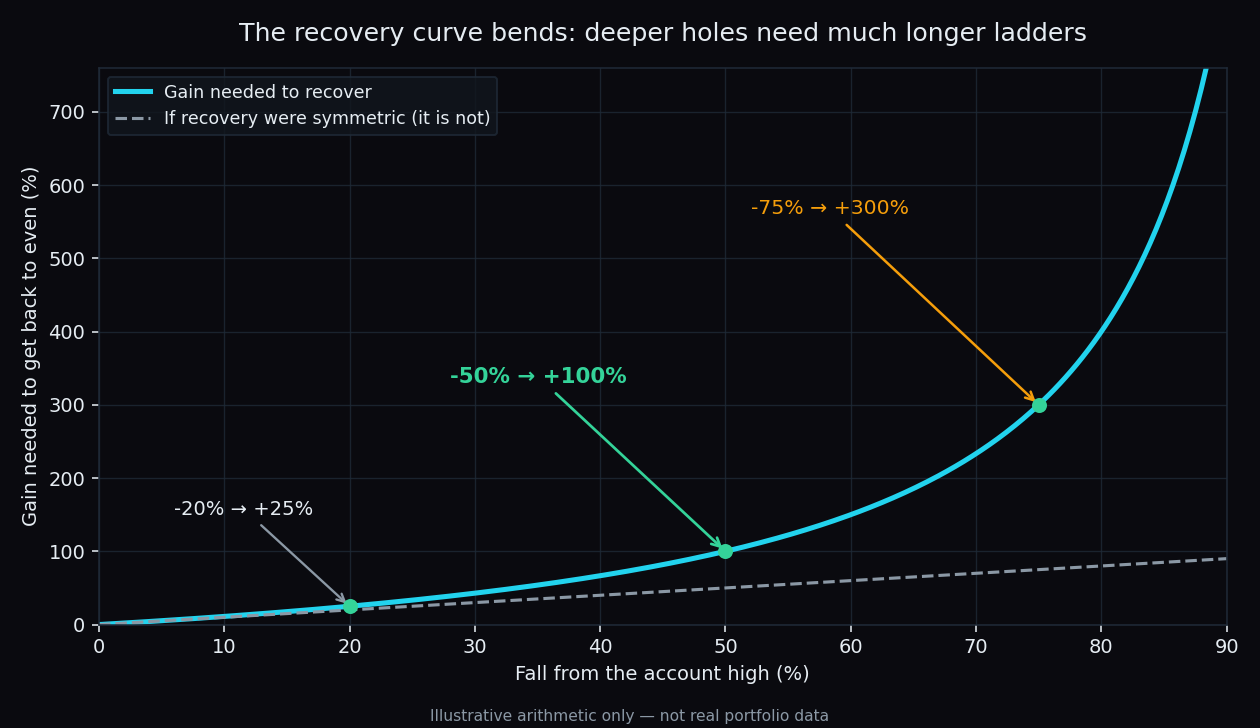
An everyday way to hold it: the deeper the hole you dig, the longer the ladder you need to climb out — and the ladder grows faster than the hole does. Twice the depth is far more than twice the climb.
Small losses stack into big ones
Most large drawdowns are not one dramatic session. They are an accumulation, and accumulation is also multiplication rather than addition.
Ten losses of 10% each do not add up to −100%. Each 10% is taken off a smaller balance than the last, so ₹1,00,000 becomes ₹34,868 — a fall of about 65%. Better than wiping out, but the recovery needed is now roughly +187%. Ten modest, individually survivable losses have quietly created a hole that needs the account to nearly triple.
This is the arithmetic sitting underneath position sizing and behind the reason a stop-loss exists as a concept at all. Neither is about being right more often. Both are about keeping single losses in the region where the recovery percentage is still close to the loss percentage.
Leverage moves you along the curve faster
In cash equity, an account's drawdown roughly tracks what the stocks in it did. In futures and options, it does not. Margin and leverage mean a small move in the index becomes a large move in the account: at roughly 5x effective exposure, a 2% move against the position is about 10% of capital, and a 10% move is the whole of it.
That is the mechanical reason leveraged accounts land in the steep part of the recovery curve so much faster than long-term equity portfolios do — and it sits alongside the costs and the loss rates covered in SEBI's study on F&O traders and in the real cost of one trade. Every rupee of brokerage, STT and slippage is a small drawdown of its own, and it compounds the same way.
What our own scored data adds to this
Drawdown math matters most when you accept that no market read is right every time. We publish our own hit-rates precisely so that number is visible rather than assumed. Across roughly 879 scored instrument-sessions on 14 instruments, our current published figures include:
- Nifty's call wall (the strike with the heaviest call open interest) held when price touched it in 78% of cases — but that is n=18 touches, a small sample.
- Nifty's put wall held in 70% of touches (n=23).
- Bank Nifty's call wall held in only 29% of touches (n=7) — a genuinely weak, genuinely small sample that we publish anyway.
Read those alongside the arithmetic above. Even a level that holds four times out of five misses one time in five, and a run of two or three misses in a row is entirely ordinary. Whether that run leaves an account slightly dented or deeply impaired is decided by drawdown math, not by the hit-rate. The full, unfiltered numbers — including every miss and every small sample — are on our public levels scoreboard.
The honest takeaway: you cannot out-predict this arithmetic. Being right more often shifts your results at the margin; how large you let a single loss become decides which part of the recovery curve you have to climb.
The honest catch
Three limits worth stating plainly.
First, this is arithmetic, not prediction. The formula tells you what a recovery requires; it says nothing about whether one will happen, or when. A broad index has historically ground back to old highs over long horizons; an individual leveraged account has no such assurance, and an individual stock certainly does not.
Second, the missing dimension is time. A 50% drawdown does not just need a 100% gain — it needs however many years that gain takes, during which the money is not doing anything else. The cost of a deep drawdown is partly the capital and partly the calendar.
Third, our published hit-rates carry the caveats we always attach to them: samples of 7 to 23 touches are small, they cover our own snapshot archive only, and they describe market structure rather than telling anyone what to do. All of it is descriptive. What you do with it is your call, and a conversation for you and your own financial adviser.
TrueTrend was built so this kind of context is a glance, not a spreadsheet: positioning, levels and market structure across Nifty, Bank Nifty and the F&O list on one screen — with our own hit-rates published in the open, misses included. Create a free TrueTrend account to see the current read.
See these concepts on live market data — free
Create a free TrueTrend account to watch daily support/resistance levels, market regime, and option-positioning charts on NIFTY, BankNifty and 12 more instruments. Every level we publish is scored on a public scoreboard — misses included. No card required.
Free forever tier · daily levels with published hit-rates across every instrument. Descriptive market structure, not investment advice.
Not ready for an account? Get the daily levels by email.
One short email each market day — the indices' call wall, put wall, gamma flip and max pain, and how the last session's levels scored. Free, no account, unsubscribe anytime.
Descriptive market structure, not investment advice. We never share your email.