The SEBI Study: Why 9 Out of 10 F&O Traders Lose Money
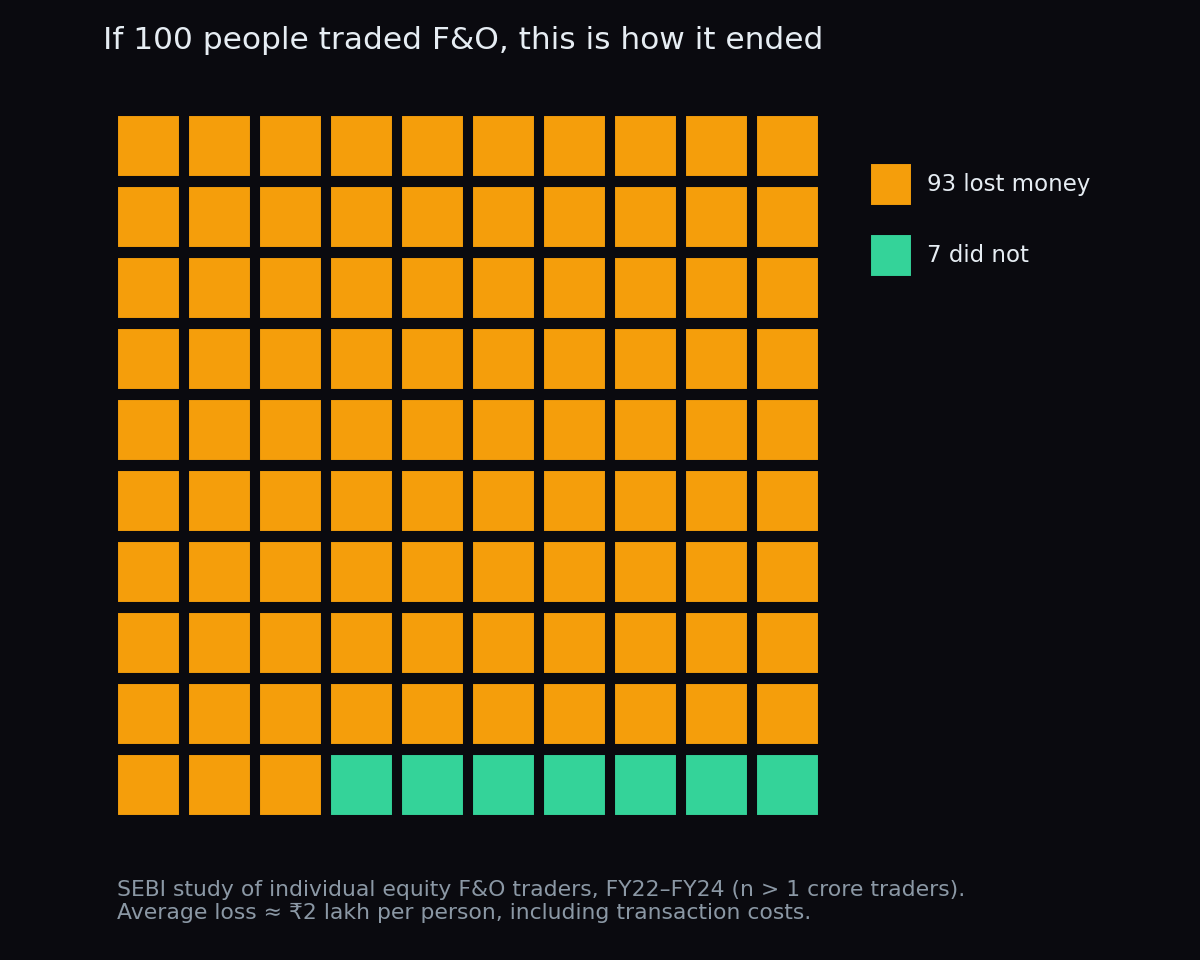
In September 2024, India's market regulator published one of the most sobering numbers in retail finance: 93% of individual futures and options (F&O) traders lost money between FY22 and FY24. Not a survey. Not an estimate. SEBI counted the actual profit and loss of more than 1 crore real trading accounts. The average loss worked out to roughly ₹2 lakh per person, and the combined losses crossed ₹1.8 lakh crore in three years. This post walks through what the study measured, who ended up with the money, and what the data quietly teaches.
First, the basics: who is SEBI, and what is F&O?
SEBI (the Securities and Exchange Board of India) is the regulator that oversees India's stock markets — roughly the referee of the game. F&O stands for futures and options: contracts whose value depends on something else, usually an index like NIFTY or a stock. If derivatives are new to you, our explainer on what derivatives are covers the idea from zero, and calls and puts explained covers options specifically.
Because SEBI can see exchange data directly, it can do something no YouTube poll or broker survey can: measure the actual outcome of every individual trader in the segment. It did this twice. A January 2023 study found that 89% of individual equity F&O traders lost money in FY22 (average loss: ₹1.1 lakh), from a base of 45.2 lakh traders. The updated September 2024 study widened the window to three full years, FY22 to FY24, and the trader base had ballooned past 1 crore people.
The headline numbers
All figures below are from SEBI's September 2024 study of the equity derivatives segment, covering FY22–FY24, with a base of over 1 crore individual traders:
- 93% lost money, with an average loss of about ₹2 lakh per trader over the three years, including transaction costs.
- The worst-hit 3.5% of loss-makers — roughly 4 lakh people — lost an average of ₹28 lakh each.
- Only about 1% of individual traders earned more than ₹1 lakh in profit after transaction costs.
- Aggregate individual losses exceeded ₹1.8 lakh crore across FY22–FY24.
Read that middle line again. It is not just that most people lost. It is that meaningful profit was rare even among the people who did not lose: for every 100 traders, roughly one cleared ₹1 lakh in profit over three years.
Where did the money go?
An F&O contract is a two-sided agreement: for every rupee one side gains, the other side gives one up. So if individuals as a group lost heavily, someone else was on the other side of those contracts.
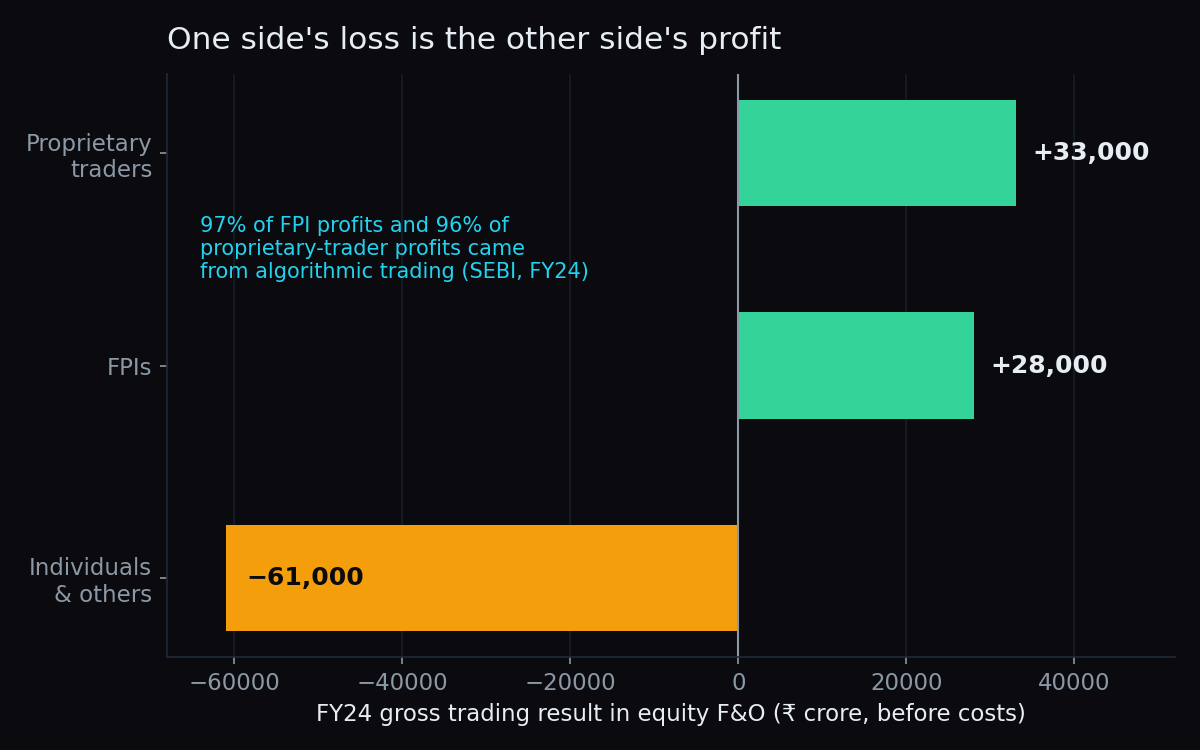
SEBI's FY24 breakdown names them. Proprietary trading firms (firms trading their own capital) booked about ₹33,000 crore in gross trading profits, and foreign portfolio investors (FPIs) booked about ₹28,000 crore — both before transaction costs. Individuals and other participants, as a class, lost over ₹61,000 crore gross in the same year. And the winners' edge was largely automated: 97% of FPI profits and 96% of proprietary-trader profits came from algorithmic trading.
Here is an everyday analogy. Imagine a neighbourhood chess club where anyone can pay a small fee per game and sit across the board from whoever turns up. Now imagine that most of the opponents turning up are professionals playing dozens of boards at once with computer assistance. Some club members will still win games. But across the whole room, over a whole year, the direction the money flows is not a mystery — and the per-game fee is charged whether a member wins or loses.
The quiet leak: transaction costs
That per-game fee is the study's most underrated finding. In FY24 alone, the average individual F&O trader paid about ₹26,000 in transaction costs — brokerage, exchange fees, taxes and other charges. Over the three years, individuals collectively paid around ₹50,000 crore in such costs, of which 51% was brokerage and 20% exchange fees. Costs are subtracted from every trader, every trade, regardless of outcome.
A worked example with simple, made-up numbers shows why this matters so much. Suppose a trader has zero skill either way: 60 trades, alternating between a ₹1,000 win and a ₹1,000 loss — a pure coin flip. Gross, the account ends flat at ₹0. Now subtract a modest ₹100 in total costs per trade. After 60 trades the same account is down ₹6,000 — not because any decision was wrong, but because costs only ever point one way.
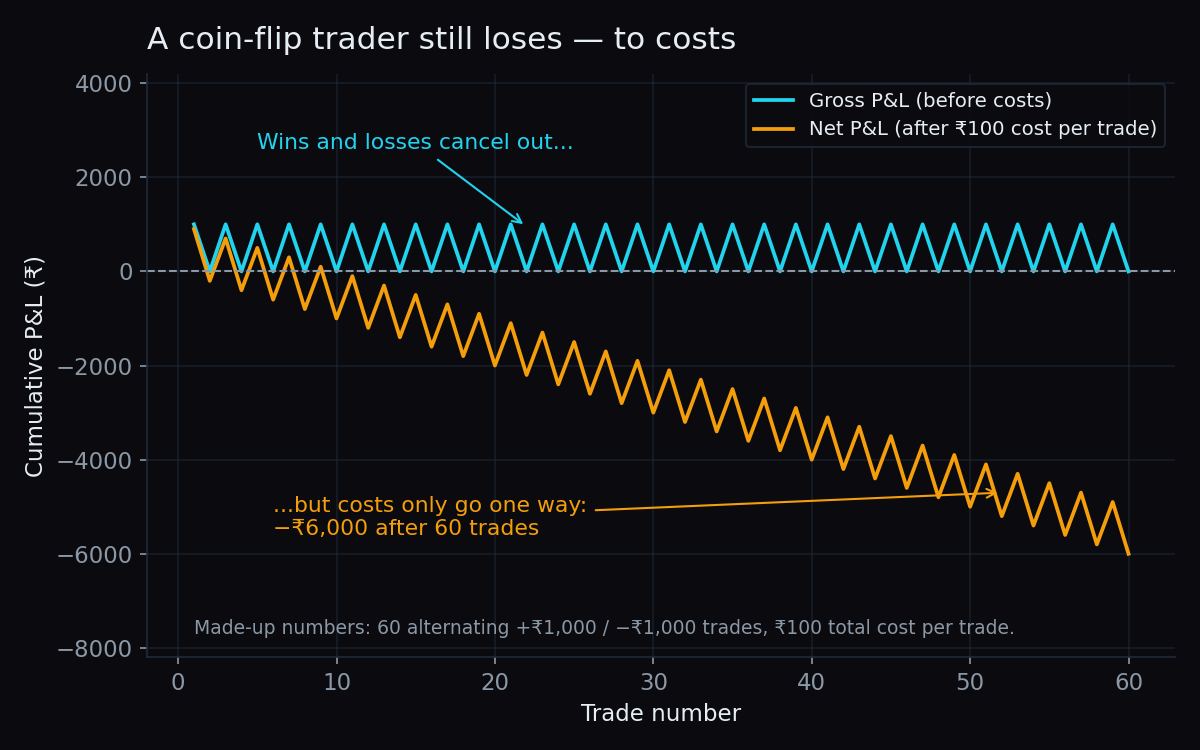
This is why "roughly break-even" traders show up as loss-makers in the data. To merely stand still, a trader has to be good enough to out-earn the fee meter — before earning anything at all.
Who is doing all this trading?
The study also profiled the people behind the accounts, and the picture is striking:
- The share of traders below 30 years of age jumped from 31% in FY23 to 43% in FY24.
- Over 72% came from beyond India's top 30 cities.
- Over 75% of individual F&O traders in FY24 had a declared annual income below ₹5 lakh.
- Despite consecutive years of losses, more than 75% of loss-making traders kept trading.
That last point is the behavioural core of the study. The data does not show people trying F&O once, losing, and leaving. It shows most loss-makers returning year after year — a pattern our post on fear and greed in trading psychology explores in more depth.
What the data teaches
SEBI's job is measurement, not motivation, and the study draws no moral. But four descriptive lessons sit plainly in the numbers:
- The base rate is the headline. Before any strategy, indicator or setup, the starting fact is that 93 of every 100 people who tried this lost money over three years. Any realistic plan has to begin by acknowledging that number, not by assuming one is the exception.
- Costs compound invisibly. The fee meter runs on every trade. More trades means a higher hurdle just to break even, as the coin-flip example shows.
- The competition is professional and automated. The consistent winners in FY24 were firms running algorithms at scale. An individual placing manual trades is, structurally, the slower player at the table.
- Unmeasured conviction is expensive. Three-quarters of loss-makers kept going without the loop of measuring whether their approach actually worked. Whatever one believes about markets, the study suggests beliefs deserve a scoreboard. That is the philosophy we apply to ourselves: our own daily market reads are scored in public on our scoreboard — for example, the NIFTY put wall has held on 70% of the sessions where price touched it (n=23) — small samples, honestly labelled.
The honest catch: what the study does not say
A famous statistic invites lazy conclusions, so it is worth being precise about the limits:
- It does not say every individual must lose. Around 7% did not lose, and about 1% earned over ₹1 lakh after costs. Rare is not impossible — but the study says nothing about how to identify those people in advance, and three years of results still mixes skill with luck.
- It does not say markets are rigged. The losses trace to identifiable, legal mechanics: two-sided contracts, better-equipped counterparties, and relentless costs.
- It is a snapshot of FY22–FY24. Derivatives rules have changed since (contract sizes, expiry schedules), so the exact percentages can differ in later periods, even if the structure of the finding has been stable across SEBI's studies.
- Averages hide spread. "₹2 lakh average loss" contains both a student who lost ₹8,000 and a business owner who lost ₹28 lakh.
Key takeaway: SEBI measured over 1 crore real accounts and found 93% of individual F&O traders lost money over FY22–FY24, while algorithm-driven firms captured the profits and everyone paid the costs. The single most useful habit the data points to is measurement itself — knowing, in numbers, whether what you are doing actually works.
If you want the measured view of the market instead of loud opinions, TrueTrend turns NIFTY and Bank NIFTY positioning into a clear, at-a-glance read — and scores its own track record in public, so you can judge it the same way SEBI judged the industry. Create a free account to see it live.
See these concepts on live market data — free
Create a free TrueTrend account to watch daily support/resistance levels, market regime, and option-positioning charts on NIFTY, BankNifty and 12 more instruments. Every level we publish is scored on a public scoreboard — misses included. No card required.
Free forever tier · daily levels with published hit-rates across every instrument. Descriptive market structure, not investment advice.
Not ready for an account? Get the daily levels by email.
One short email each market day — the indices' call wall, put wall, gamma flip and max pain, and how the last session's levels scored. Free, no account, unsubscribe anytime.
Descriptive market structure, not investment advice. We never share your email.