The Real Cost of One Trade: Brokerage, STT, GST & Slippage
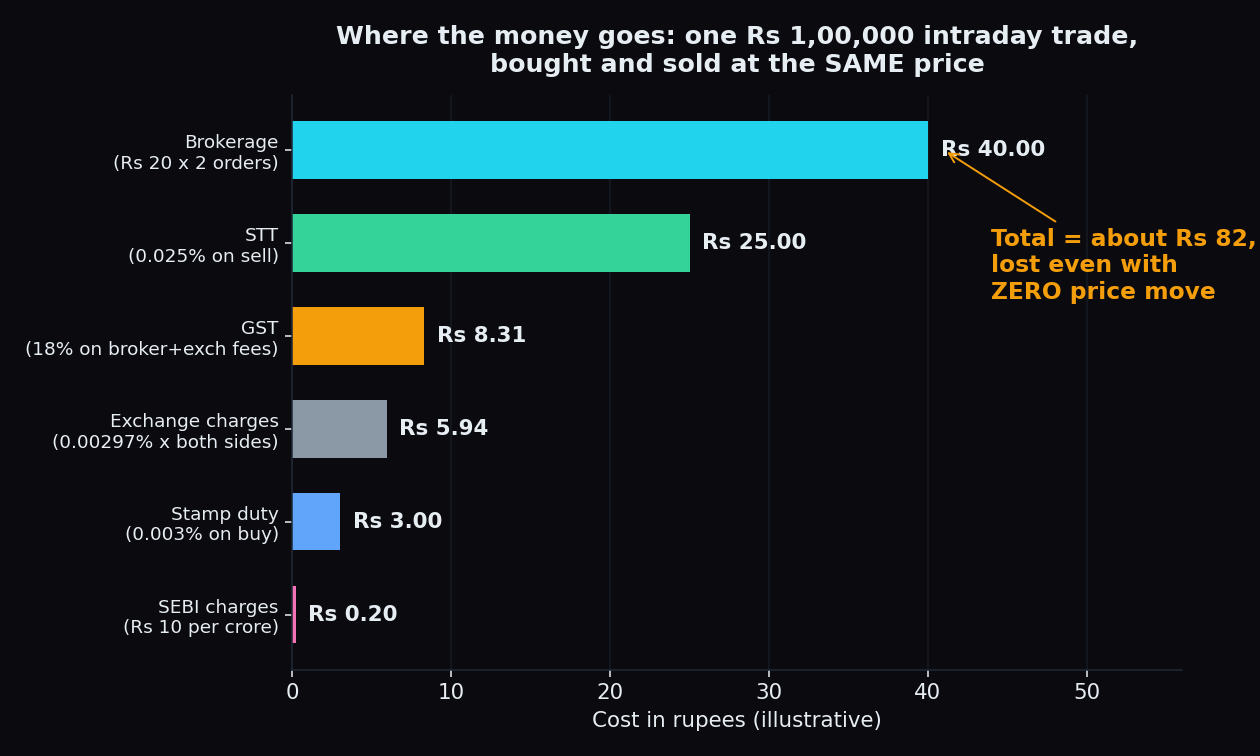
You press one button to get in and one to get out. Between those two clicks, several parties quietly take a small cut: your broker, the exchange, the market regulator, the state government, the tax department — and the market itself. On a Rs 1,00,000 intraday trade where the price does not move at all, those cuts add up to roughly Rs 82. That sounds tiny. Added up across a month of trading, it is not. This post totals the bill, line by line, so you know exactly what one trade really costs.
The six charges on every trade
Think of a trade like a food-delivery bill. The dish is the price of the stock. Then come the delivery fee, the platform fee, the packaging charge and the taxes — each small on its own, meaningful together. A trade in India has the same structure:
- Brokerage — the fee your broker charges for executing an order. Discount brokers typically charge a flat fee of up to Rs 20 per executed order for intraday and F&O trades (many charge zero brokerage on equity delivery). Full-service brokers often charge a percentage of the trade value instead.
- Securities Transaction Tax (STT) — a central-government tax on the traded value. Broadly: 0.1% on both legs for equity delivery, 0.025% on the sell leg for equity intraday, 0.02% on the sell leg for futures, and 0.1% of the premium on the sell leg for options (with a separate 0.125% of intrinsic value if an option is exercised).
- Exchange transaction charges — the exchange's fee for using its platform. On NSE, roughly 0.00297% of turnover for equities, 0.00173% for futures, and 0.03503% of premium turnover for options.
- SEBI turnover fees — the market regulator's charge: Rs 10 per crore of turnover. Tiny, but it is on the bill.
- Stamp duty — a duty on the buy side only: 0.015% for equity delivery, 0.003% for intraday and options, 0.002% for futures.
- GST — an 18% tax applied on the brokerage, exchange charges and SEBI fees (not on STT or stamp duty).
Delivery trades add one more line: a depository (DP) charge of roughly Rs 15–20 plus GST per stock, per day, whenever shares leave your demat account on a sale.
The rates above are the commonly applied NSE rates as of July 2026 (last broadly revised in October 2024). Exact paise vary a little by broker, exchange and state — your contract note is always the final word.
Worked example 1: one intraday stock trade
Keep the numbers simple. Say a trader takes an intraday position of 200 shares of a Rs 500 stock — Rs 1,00,000 in — and exits at exactly Rs 500. No gain, no loss on price. Here is the bill with a typical discount broker:
- Brokerage: Rs 20 per executed order × 2 orders = Rs 40.00
- STT: 0.025% of the Rs 1,00,000 sell leg = Rs 25.00
- Exchange transaction charges: 0.00297% of Rs 2,00,000 total turnover = Rs 5.94
- SEBI fees: Rs 10 per crore on Rs 2,00,000 = Rs 0.20
- Stamp duty: 0.003% of the Rs 1,00,000 buy leg = Rs 3.00
- GST: 18% of (brokerage + exchange + SEBI charges) = 18% of Rs 46.14 = Rs 8.31
Total: about Rs 82 — paid in full even though the price never moved.
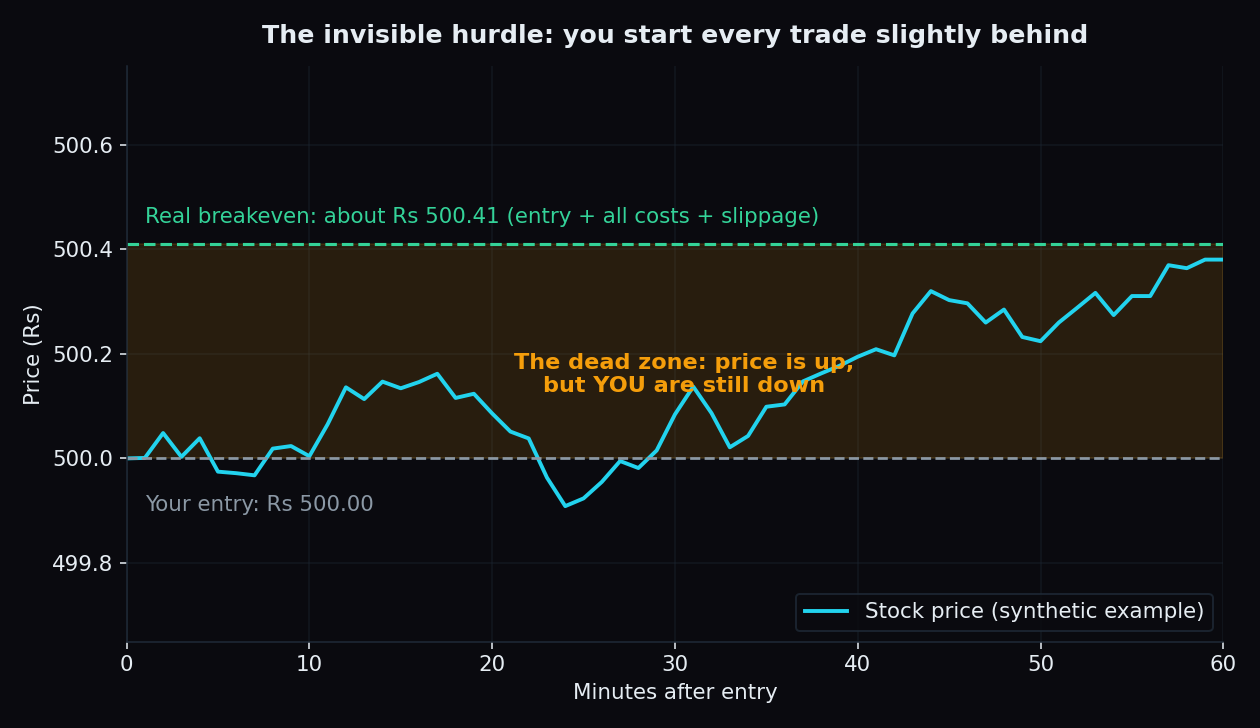
Rs 82 on Rs 1,00,000 is 0.082% of the position. That percentage is the trade's invisible hurdle: on this Rs 500 stock, the price must reach about Rs 500.41 before the position is genuinely at breakeven. Anywhere between Rs 500.00 and Rs 500.41 is a dead zone — the screen shows green, but the trader is still down.
Worked example 2: one Nifty options round trip
Options look cheaper because the premium is small, but the percentages work differently. Say a trader takes one lot of a Nifty option (75 units per lot — see lot size and contract value) at a premium of Rs 100 and exits at Rs 110:
- Premium paid: 75 × Rs 100 = Rs 7,500. Premium received: 75 × Rs 110 = Rs 8,250. Gross profit: Rs 750.
- Brokerage: Rs 20 × 2 = Rs 40.00
- STT: 0.1% of the Rs 8,250 sell leg = Rs 8.25
- Exchange transaction charges: 0.03503% of Rs 15,750 premium turnover = Rs 5.52
- SEBI fees: Rs 0.02
- Stamp duty: 0.003% of the Rs 7,500 buy leg = Rs 0.23
- GST: 18% of Rs 45.54 = Rs 8.20
Total: about Rs 62 — roughly 8% of the Rs 750 gross profit. A move that looked like a clean 10% gain on the premium quietly became about 9.2%. And on a losing trade, the same Rs 62 is added on top of the loss.
Slippage: the charge nobody bills you
Slippage is the gap between the price you expected and the price you actually got. It never appears on the contract note, which is exactly why it is easy to ignore.
The analogy: a currency counter at the airport. The board says Rs 84 per dollar, but the counter buys from you at Rs 83.60 and sells to you at Rs 84.40. The gap is how the counter earns. Markets work the same way — there is always a bid-ask spread, and a market order crosses it (see what slippage is and market orders vs limit orders).
Back to the Nifty option example: if the option quotes Rs 99.80 bid / Rs 100.20 ask, entering and exiting with market orders gives up about Rs 0.20 per unit per leg — 75 × Rs 0.20 × 2 = Rs 30. That single invisible line is roughly half of all the visible charges combined. In fast-moving or illiquid contracts, it can be several times larger.
Why 'small' costs decide who survives
One Rs 82 charge is noise. The repetition is what matters. A trader who does two intraday round trips a day, twenty days a month, pays roughly 40 × Rs 82 ≈ Rs 3,300 a month — about 3.3% of a Rs 1,00,000 account — before counting a single losing trade or any slippage.
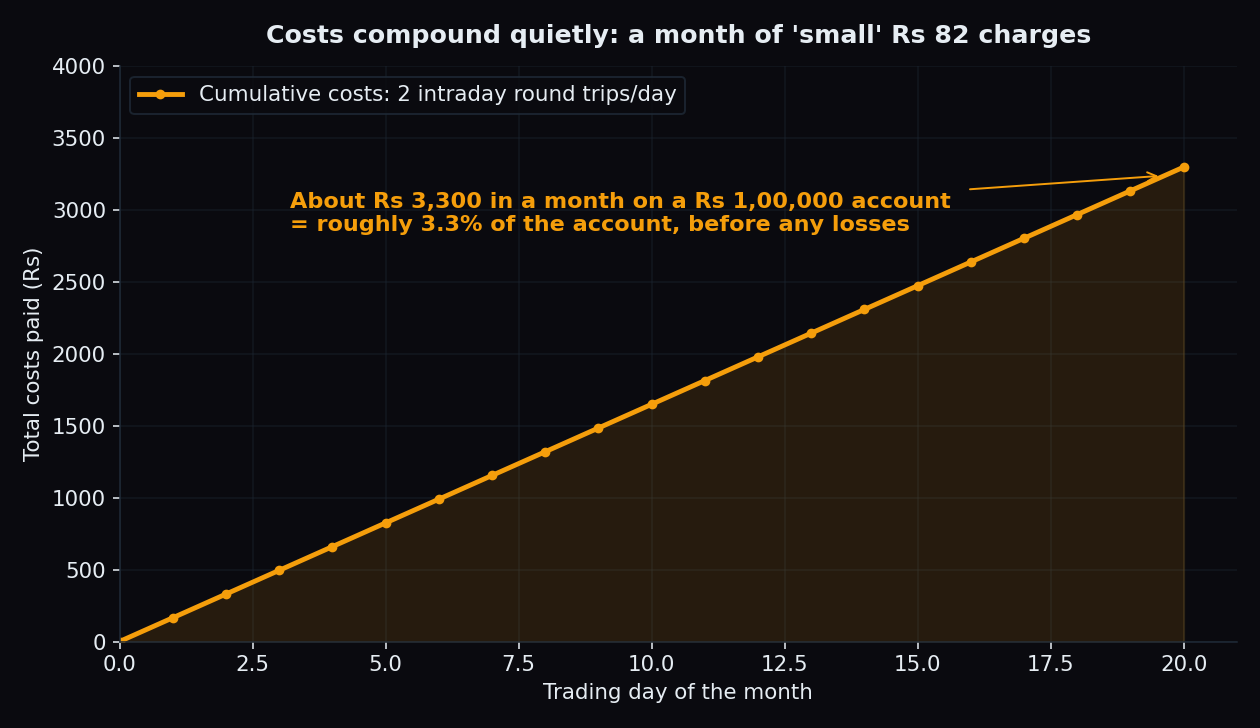
To merely stand still, that account must earn about 3.3% a month from the market — an outcome most professionals would consider excellent. SEBI's own research on index derivatives (its September 2024 study covering FY22–FY24) found that about 9 in 10 individual F&O traders lost money, and that transaction costs alone consumed a meaningful share of what active traders paid out. Costs are not a footnote to that statistic; they are part of the mechanism.
Key takeaway: costs are the only part of a trade that is certain. The market move is a probability; the Rs 82 is a fact. Every extra trade is a certain debit chasing an uncertain credit.
The honest catch
None of this means trading is pointless — it means the bar is higher than the screen suggests. Three honest observations follow from the arithmetic:
- Frequency is a cost multiplier. The bill scales with the number of trades, not with how clever they are. Ten mediocre trades cost ten bills; one considered trade costs one.
- Slippage responds to behaviour. Liquid instruments and patient limit orders shrink the invisible line; market orders in illiquid contracts inflate it.
- The hurdle must be part of the plan. An expected move smaller than the round-trip cost is not an edge — it is a donation. And note that none of the numbers above include income tax on gains, which sits on top.
Costs are one half of the arithmetic; knowing what the market is actually positioned for is the other. TrueTrend turns Nifty & Bank Nifty option positioning into a clear, at-a-glance read — and scores its own track record in public, so you can judge it before you rely on it. Create a free account and see for yourself.
See these concepts on live market data — free
Create a free TrueTrend account to watch daily support/resistance levels, market regime, and option-positioning charts on NIFTY, BankNifty and 12 more instruments. Every level we publish is scored on a public scoreboard — misses included. No card required.
Free forever tier · daily levels with published hit-rates across every instrument. Descriptive market structure, not investment advice.
Not ready for an account? Get the daily levels by email.
One short email each market day — the indices' call wall, put wall, gamma flip and max pain, and how the last session's levels scored. Free, no account, unsubscribe anytime.
Descriptive market structure, not investment advice. We never share your email.