Synthetic Futures: How Options Can Mimic a Future
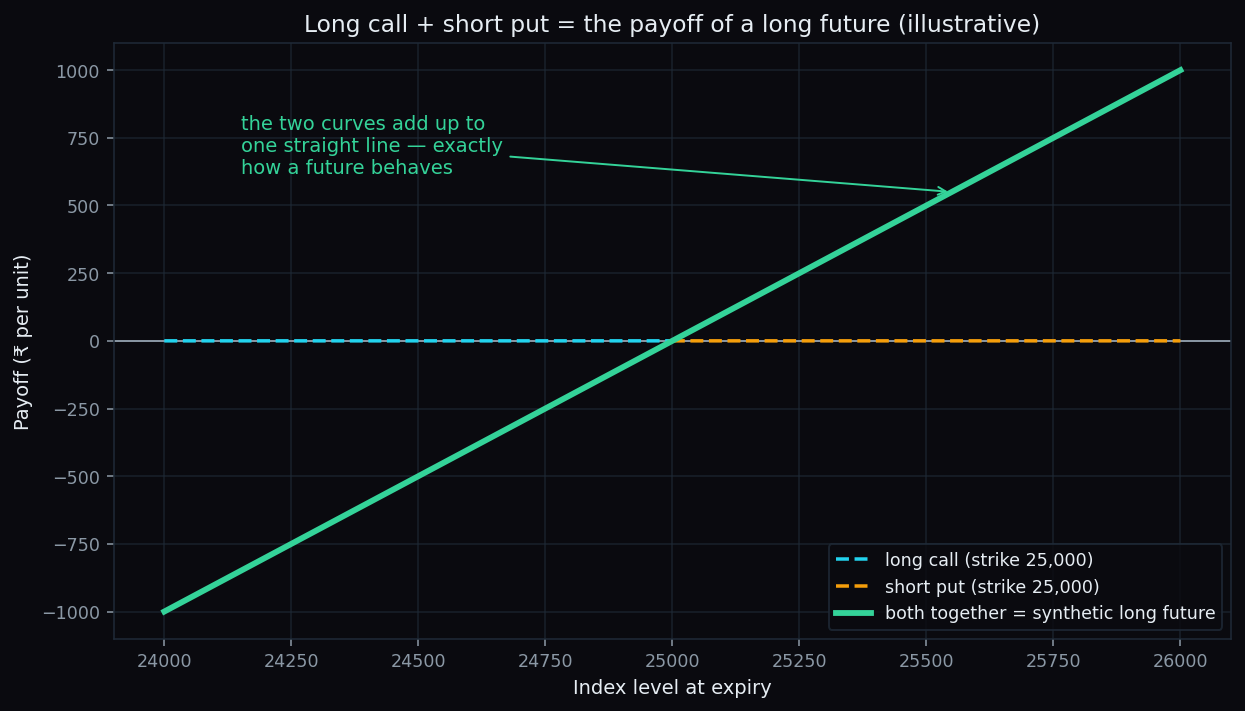
Here is a strange but true fact about markets: two options, held together, can behave exactly like one future. Go long a 25,000-strike call and write a 25,000-strike put on the same expiry, and your profit and loss moves one-for-one with the index — just as a futures position would. Traders call this a synthetic future. This post shows how the trick works, with round numbers, simple pictures, and an honest look at the costs.
First, the three words you need
A quick refresher — skip ahead if you know these. A future is a firm two-way contract on an index or a stock: if the market rises you gain, if it falls you lose, rupee for rupee. A call option gives its holder the upside above a fixed level called the strike, with nothing lost below it beyond the price paid. A put option is the mirror image: its holder gains when the market finishes below the strike. The price of an option is its premium. If all of this is new, start with our explainer on what derivatives are and come back.
The Lego analogy
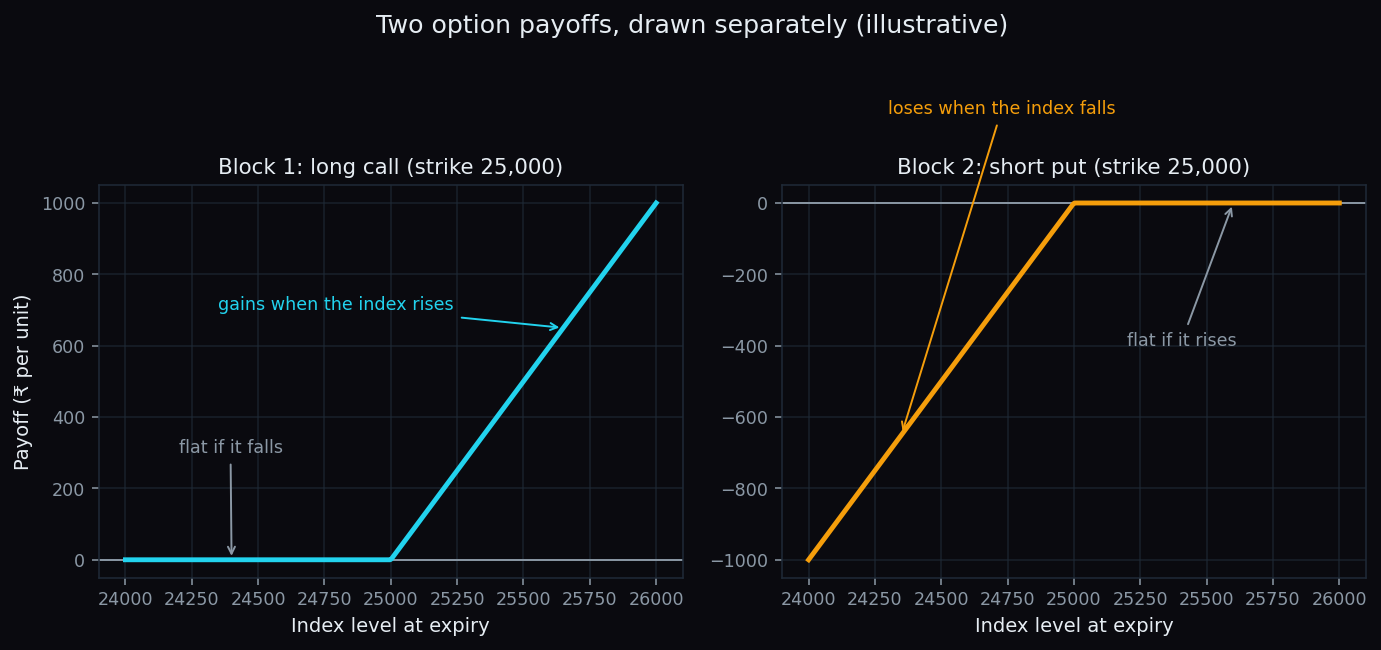
Think of a futures payoff as one solid Lego brick: the top half is “gain when the market rises” and the bottom half is “lose when the market falls.” A long call is only the top half of that brick. A short put — where you write the put and take on the downside — is only the bottom half. Snap the two halves together at the same strike and expiry, and you have rebuilt the whole brick.
The recipe
Same strike, same expiry, one of each:
- Synthetic long future = long one call + short one put.
- Synthetic short future = long one put + short one call.
Why does it work? At expiry, exactly one of the two options matters. If the index finishes above the strike, the call pays the entire rise and the put expires worthless. If the index finishes below, the call expires worthless and the short put loses the entire fall. Either way, the pair is worth index level minus strike. Plot that and you get a straight line — the signature of a future.
Key idea: an option payoff is a bent line. Take one line bent upward (the long call) and one bent downward (the short put), and the kinks cancel — leaving the straight line of a future.
A worked example with round numbers
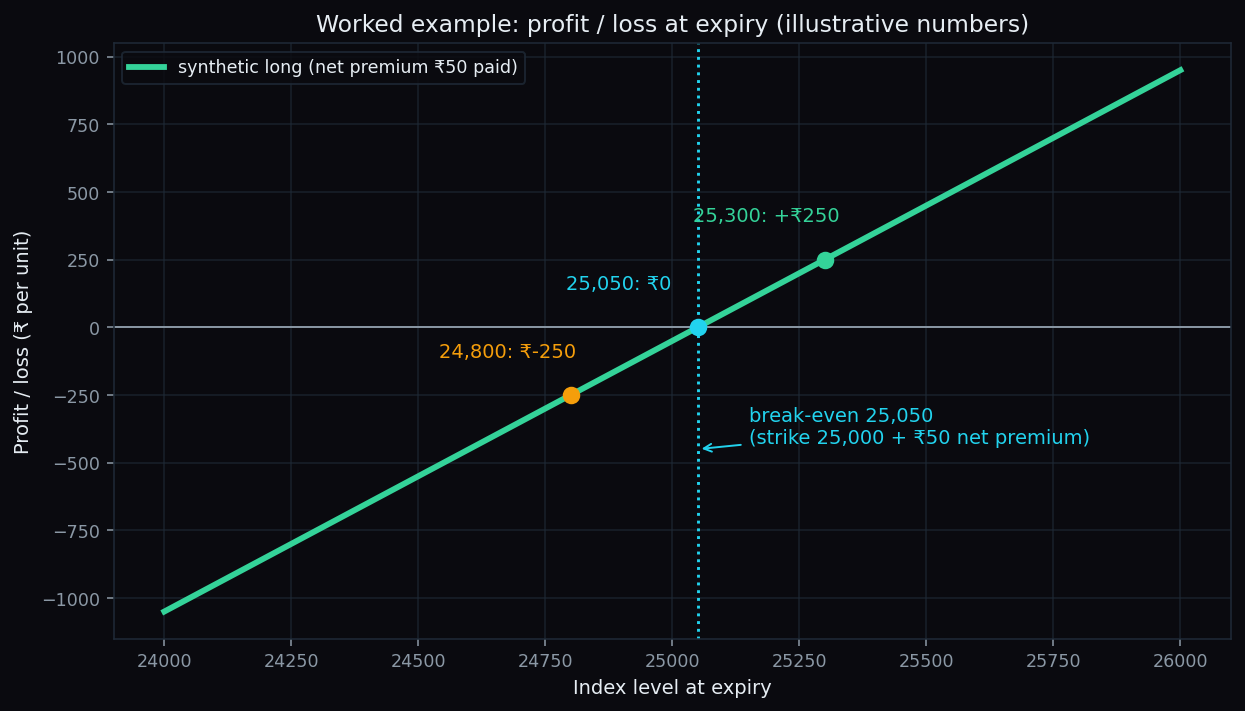
Say Nifty is at 25,000. The one-month 25,000 call trades at ₹200 and the 25,000 put at ₹150 — illustrative numbers, not live quotes. You go long the call (pay ₹200) and write the put (receive ₹150). Net outlay: ₹50 per unit of the index.
At expiry the pair is worth the index level minus 25,000. Deduct the ₹50 net premium and you get the profit or loss:
- Index at 24,800 → −200 − 50 = −₹250 per unit.
- Index at 25,050 → +50 − 50 = ₹0 — the break-even.
- Index at 25,300 → +300 − 50 = +₹250 per unit.
Now compare that with holding an actual future entered at 25,050: the outcomes are identical at every index level. The two options have rebuilt a future priced at strike plus net premium — 25,000 + 50 = 25,050. Real contracts come in exchange-set lots, so every rupee figure above scales by the lot size.
Why the two prices stay tethered
There is a rule hiding in that example, known as put-call parity: at the same strike and expiry, call premium minus put premium is roughly the futures price minus the strike. In our numbers: 200 − 150 = 50, and 25,050 − 25,000 = 50. It balances exactly.
What keeps it balanced? Arbitrage. If the synthetic version ever drifted meaningfully cheaper than the real future, professional desks would take the cheap one, short the rich one, and lock in the gap with very little risk. That activity itself pulls the prices back together. This is why option and futures prices on liquid indices rarely disagree for more than moments.
Why anyone builds a future this way
- Flexibility. The two legs can be closed separately. A position built from parts can be reshaped one part at a time; a future is all-or-nothing.
- Liquidity differences. At times, options at a given strike are more liquid or better priced than the corresponding future, especially near expiry.
- Reading the market. Many professional structures — conversions, reversals, boxes — are built on this equivalence. Even if you never touch one, knowing it helps you read an option chain: the chain quietly contains the futures price. Our piece on option delta is a natural next step — a synthetic future is simply a position whose delta is fixed at one.
The honest catch
- Two legs, two costs. You cross two bid-ask spreads and pay charges on two contracts instead of one.
- Margin. Writing the put is not a “pay-premium-and-forget” position. The short leg carries futures-like margin requirements, and losses on a fall are open-ended, exactly as with a future.
- Legging risk. Place the two orders one after the other and the market can move in between, so the pair may be assembled at worse prices than planned.
- Expiry mechanics. NSE index options are European-style and cash-settled, which keeps index synthetics clean. Single-stock options settle by physical delivery, which adds real complexity — verify the contract rules before assuming the index logic carries over.
Everything above is an illustration of market structure, meant for understanding — not a template to replicate. The equivalence is exact on paper; in live markets, costs, margins and execution decide whether it makes sense, and that judgment is yours alone.
Where positioning meets proof: TrueTrend turns option-chain structure like this into a clear, at-a-glance read across Nifty, Bank Nifty and F&O — and scores its own track record in public. Create a free account to see today’s picture.
See these concepts on live market data — free
Create a free TrueTrend account to watch daily support/resistance levels, market regime, and option-positioning charts on NIFTY, BankNifty and 12 more instruments. Every level we publish is scored on a public scoreboard — misses included. No card required.
Free forever tier · daily levels with published hit-rates across every instrument. Descriptive market structure, not investment advice.
Not ready for an account? Get the daily levels by email.
One short email each market day — the indices' call wall, put wall, gamma flip and max pain, and how the last session's levels scored. Free, no account, unsubscribe anytime.
Descriptive market structure, not investment advice. We never share your email.