What Is Fundamental Analysis? A Complete Beginner's Guide
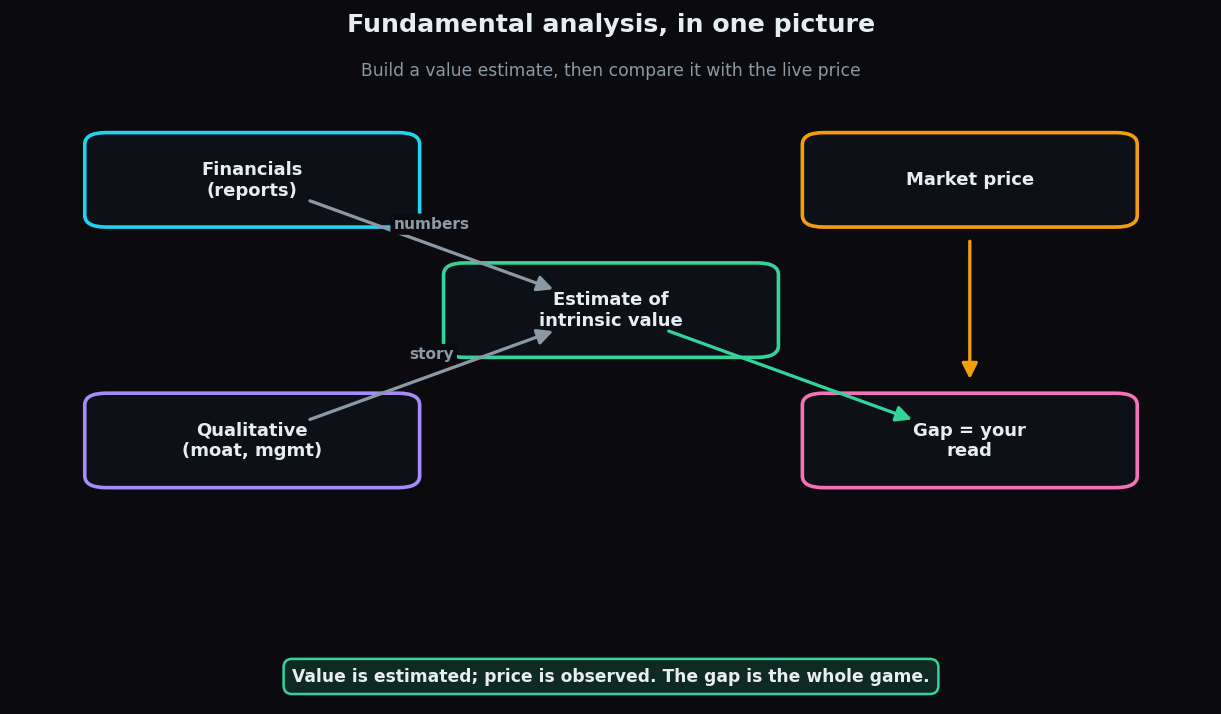
Every share price is really two numbers wearing one label. There is the price — what the market is charging today — and there is value, what the business is actually worth. Fundamental analysis is the craft of estimating that second number, so you can judge the first one for yourself. This is a complete, plain-English guide to how it works and where it falls short.
Think of it like buying a used car. The sticker says one lakh. Fundamental analysis is you opening the bonnet, checking the engine, the service history and the mileage, and forming your own view of what the car is worth. The sticker is the price. Your inspection produces the value.
What fundamental analysis actually is
Fundamental analysis is the study of a business to estimate its intrinsic value — a considered guess at what the company is genuinely worth based on its earnings, assets, debts and prospects. You then compare that estimate with the live market price and form a view about whether the market looks optimistic, pessimistic, or roughly fair.
The word intrinsic matters. It means value that comes from the thing itself, not from what someone will pay for it this afternoon. A mango tree's intrinsic value is the fruit it will bear for years; its market price on a given day might be silly in either direction. Fundamental analysts try to keep their eyes on the tree, not the daily auction.
The two halves: quantitative and qualitative
Good fundamental work always has two halves, and both matter.
- Quantitative — the numbers. This is everything you can measure: revenue, profit, debt, cash flow and the ratios built from them. It comes straight from a company's three core reports, the balance sheet, the income statement and the cash flow statement.
- Qualitative — the story behind the numbers. Is the brand loved? Does the company have a durable edge (a "moat") that keeps rivals out? Is management honest and capable? Is the industry growing or dying? None of this shows up as a single figure, but it decides whether the numbers will get better or worse.
Numbers without a story can mislead: a firm can look cheap because it is quietly dying. A story without numbers is just a nice feeling. You need both.
Top-down vs bottom-up
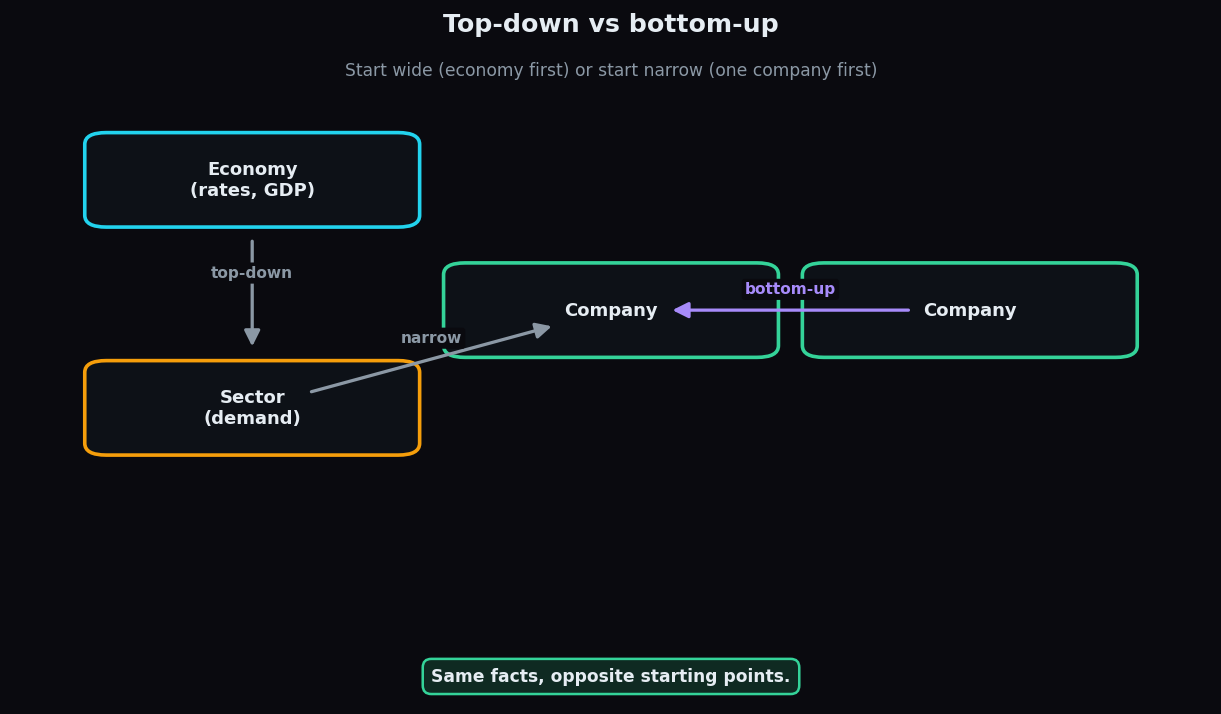
There are two directions you can travel, and neither is "correct" — they are just different starting points.
- Top-down starts wide. You look at the economy first (growth, interest rates, inflation), then pick sectors likely to do well in that climate, and only then hunt for companies inside those sectors. You are letting the big picture narrow the field.
- Bottom-up starts narrow. You find an individual company that looks strong on its own merits and study it deeply, largely ignoring where the broader economy happens to be. A wonderful business, the thinking goes, can swim against the tide.
Fundamental vs technical analysis
People often frame this as a battle, but the two disciplines simply answer different questions. Fundamental analysis asks "what is this business worth?". Technical analysis — the study of price and volume patterns on a chart — asks "where might the price move next?". One studies the company; the other studies the crowd trading it.
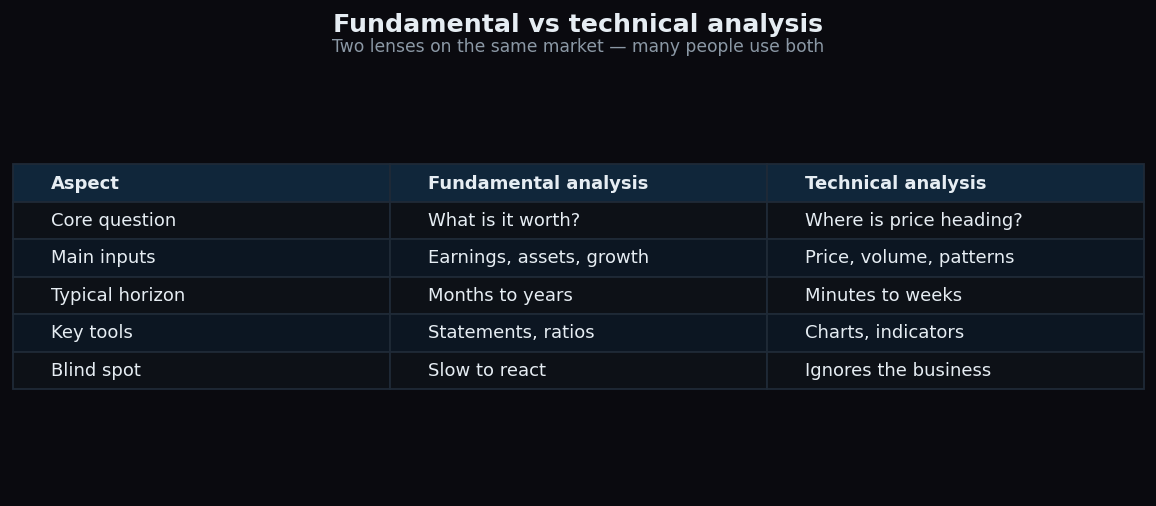
Their horizons differ too. Fundamentals move slowly, so fundamental analysis suits months and years. Price can move by the second, so technicals suit shorter windows. Many people use fundamentals to decide what they find interesting and technicals to think about timing — the two are not enemies. If you want to go deeper on the price-chart side, our explainer on moving averages is a gentle start.
A worked example with round numbers
Suppose a fictional company, Bright Bulbs Ltd, earns a steady Rs 100 crore profit a year, and you believe that will hold. A simple (deliberately crude) way to value steady earnings is to decide how many years of profit you would pay for. Say comparable businesses trade at 15 times earnings. Then a rough value estimate is:
- Rs 100 crore profit × 15 = Rs 1,500 crore estimated value.
Now look at the market. If the whole company is priced at Rs 1,000 crore, the market is valuing it below your estimate — interesting, worth understanding why. If it is priced at Rs 3,000 crore, the market expects far more growth than your flat-profit assumption allows. Neither reading is a signal to act; each is a question that sends you back to check your assumptions. The number 15 was chosen by you, and it might be wrong — which is exactly the point of the next section.
The honest catch
Fundamental analysis has real limits, and pretending otherwise is how people get hurt.
- It is only as good as your assumptions. Change the growth rate or that "15 times" multiple a little and the value estimate swings wildly. Garbage in, garbage out.
- The market can disagree for a long time. Being "right" about value is useless if price ignores you for years. Cheap can get cheaper.
- Reports look backwards. Statements describe what already happened. The future — which is what you are really buying — is never in the file.
- Numbers can be dressed up. Accounting has legal wiggle room. This is exactly why the cash flow statement, which is harder to fake, matters so much.
Used well, fundamental analysis does not hand you certainty. It hands you a reasoned estimate and a list of the things that would have to be true for it to hold — which is far more useful than a hunch.
Want to build the habit of reading market structure instead of guessing? TrueTrend is an analytics and education platform that lays out the numbers and context in plain language so you can form your own view. Create a free account to start exploring.
Key takeaways
- Fundamental analysis estimates a business's intrinsic value and compares it with the market price.
- It blends quantitative numbers (from the three financial statements) with qualitative judgement (moat, management, industry).
- Top-down starts from the economy; bottom-up starts from a single company.
- It answers "what is it worth?", while technical analysis asks "where is price going?" — different questions, often used together.
- Every estimate rests on assumptions, so treat the output as a reasoned view, not a fact.
See these concepts on live market data — free
Create a free TrueTrend account to watch daily support/resistance levels, market regime, and option-positioning charts on NIFTY, BankNifty and 12 more instruments. Every level we publish is scored on a public scoreboard — misses included. No card required.
Free forever tier · daily levels with published hit-rates across every instrument. Descriptive market structure, not investment advice.
Not ready for an account? Get the daily levels by email.
One short email each market day — the indices' call wall, put wall, gamma flip and max pain, and how the last session's levels scored. Free, no account, unsubscribe anytime.
Descriptive market structure, not investment advice. We never share your email.