Backtesting Basics: Why Most Backtests Lie to Traders
Here is an experiment that fools almost everyone. Hand 100 people a coin each and ask for ten flips. Around five of them will land eight or more heads — pure chance. Now imagine only those five publish their "track record". A backtest can do exactly this: it can make random luck look like a proven edge. This post explains what a backtest is, the specific ways it lies, and the simple checks that catch the lie.
What a backtest actually is
A backtest is a rehearsal on old data. You write down a trading rule — for example, "go long when the 20-day moving average crosses above the 50-day, exit when it crosses back" — and a computer replays the last few years of prices to see how that rule would have done.
Backtests are genuinely useful. They force you to make a rule precise, and they can kill a bad idea in minutes instead of months. But a backtest answers one narrow question: how did this rule do on this one slice of the past? The trouble starts when we quietly read that as: this is how it will do in the future.
The exam-paper analogy
Imagine a student who prepares for an exam by memorizing last year's question paper, answer by answer. Give them last year's paper and they score 100%. Give them this year's paper — new questions, same subject — and they collapse. They never learned the subject; they learned one paper.
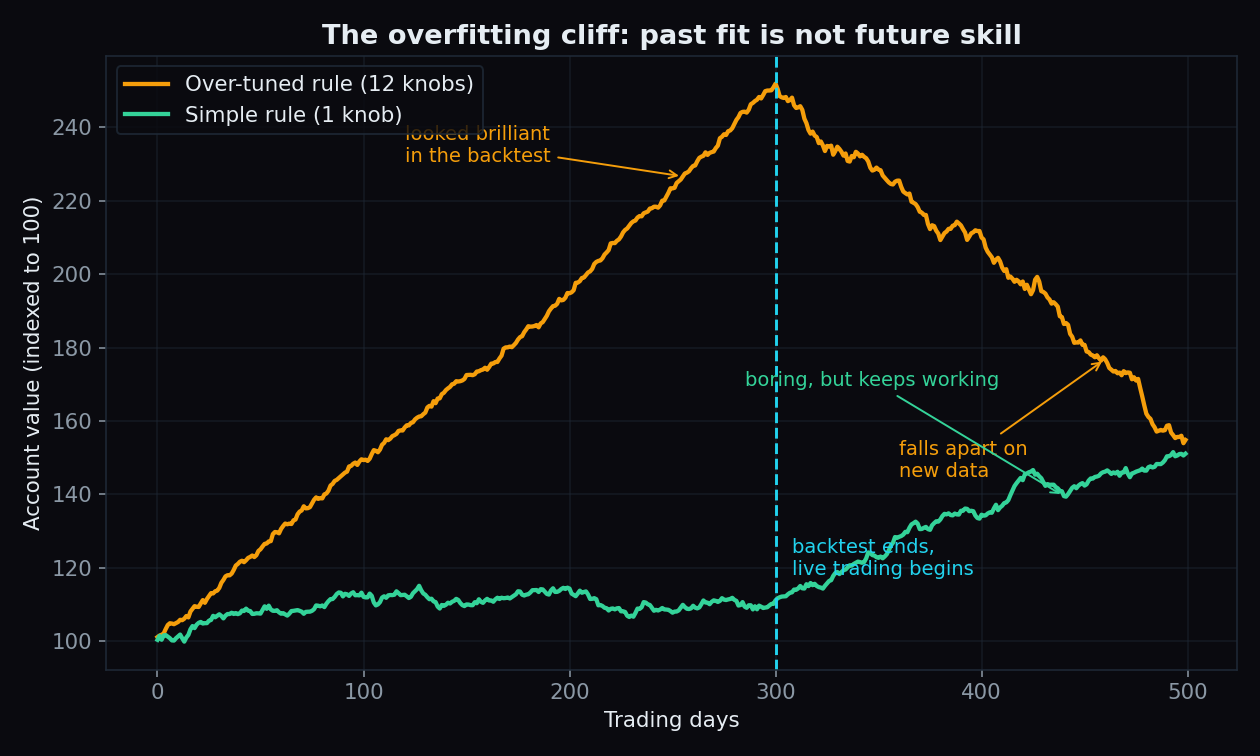
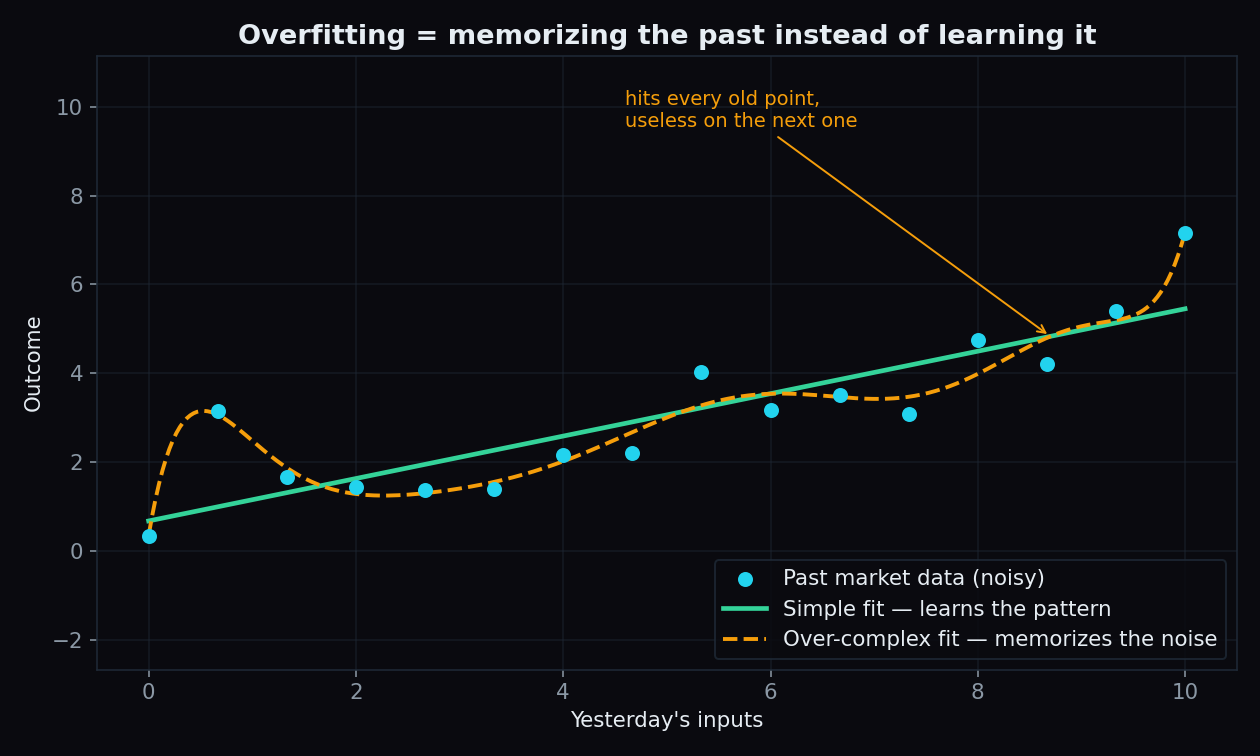
That is overfitting: a rule stops learning the market's general behaviour and starts memorizing one specific stretch of history — including its random noise. The rule looks brilliant on the data it memorized and lost on data it has never seen.
A worked example: how luck fakes skill
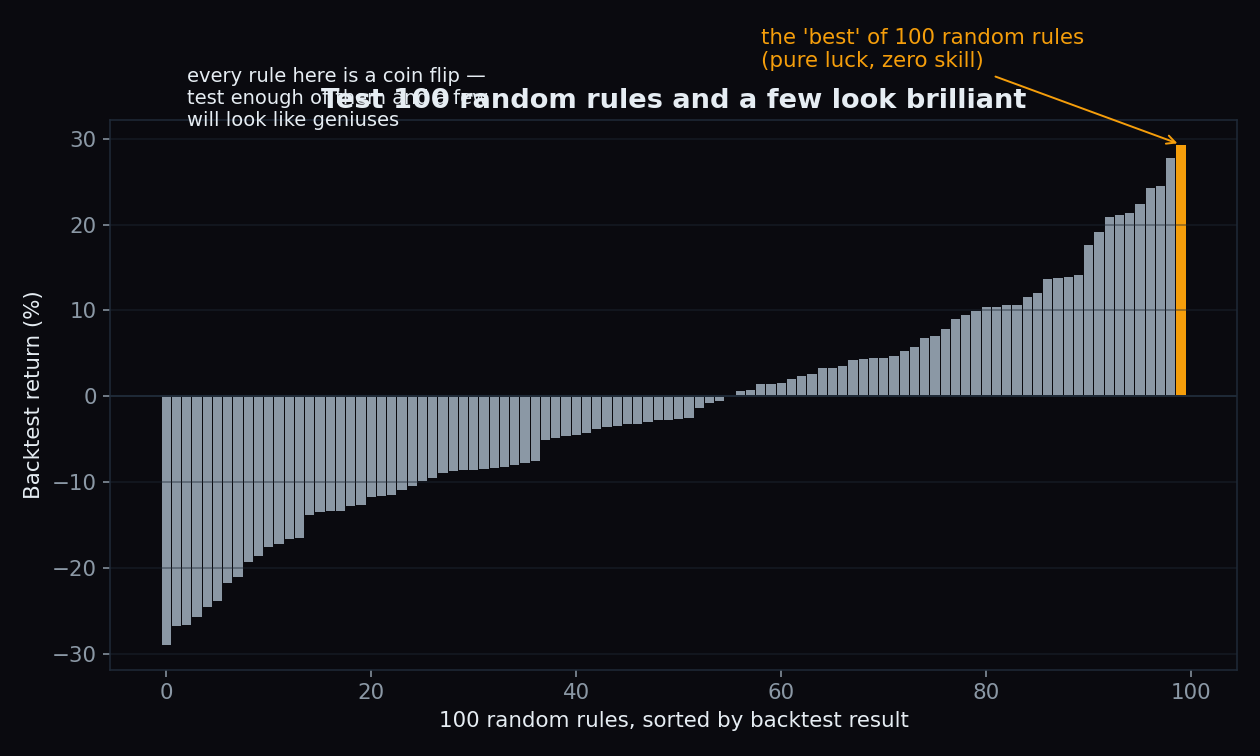
Back to the coins, with real numbers. Flip a fair coin ten times. The chance of getting eight or more heads is 56 out of 1,024 — roughly 5%, or about 1 in 18. So in a room of 100 coin-flippers, you should expect around five people with an "80% hit rate". They have zero skill. The room is just large enough for luck to show off.
Strategy testing works the same way. Test 100 random entry rules on two years of Nifty data and a handful will post smooth equity curves and high win rates by chance alone. If you are only shown the best backtest — and never the 99 discarded ones — you are not looking at skill. You are looking at luck, curated.
The five ways backtests lie
1. Overfitting: more knobs, better past, worse future
Every adjustable setting in a rule — the moving-average length, the RSI cutoff, the stop distance — is a parameter, a knob you can turn. Each extra knob lets the rule bend itself around one more bump in the old data. A 12-knob rule can be tuned until the past looks perfect; that same flexibility is what makes it fragile on new data. As a rule of thumb: every knob you add makes the backtest look better and the future look less trustworthy.
2. Look-ahead bias: reading tomorrow's newspaper
Look-ahead bias means the test accidentally uses information that was not available at the time of the trade. A classic slip: a rule that enters "at 10 a.m. if the day closes strong" — the day's close is only known at 3:30 p.m. The backtest quietly time-travels, and no live trader can copy it.
3. Survivorship bias: testing only on the winners
Run a ten-year test on today's Nifty 50 members and you have silently skipped every company that was dropped from the index or collapsed along the way. The past looks calmer and kinder than it really was, because the casualties were removed before you arrived.
4. The zero-cost fantasy
Most simple backtests assume free trades at perfect prices. Real trades pay brokerage, STT and other charges, plus slippage — the gap between the price you wanted and the price you got. A rule that earns 0.1% per trade on paper can lose money once the full cost of one trade is counted. Costs are small per trade and enormous per year.
5. Too few trades to mean anything
A "90% win rate" built on ten trades is noise, not evidence — the coin-flip room above proves it. Always ask for the sample size, the n behind the percentage. Small n is how randomness sneaks into a track record wearing a suit.
How to sanity-check any backtest
- Split the data. Tune the rule on one stretch (in-sample), then grade it on a stretch it has never seen (out-of-sample). Repeating that split as you roll forward through time is called a walk-forward test — the closest a backtest gets to honesty.
- Count the trades. Percentages built on fewer than a few hundred trades deserve suspicion, not admiration.
- Charge yourself real costs. Add brokerage, taxes and slippage to every simulated trade.
- Count the knobs. Between two rules with similar results, trust the one with fewer parameters.
- Ask what was thrown away. One published backtest often hides dozens of failed versions. The more versions tried, the less the best one means.
- Prefer forward records. A rule scored live, in public, after its call was published, cannot be quietly re-tuned to fit the answer.
The honest yardstick: scoring in public, in advance
The cleanest antidote to backtest fiction is forward scoring: publish the level in the morning, grade it against reality in the evening, and count every miss. That is how the live public scoreboard works. Right now it shows, for example, that the Nifty call wall — the strike with the heaviest call open interest, which often behaves like a ceiling — held on 76% of touches (n=21), while Nifty closed within one strike of max pain in only 40% of sessions (n=90). One number flatters, one does not; both stay on the board, because forward numbers include the misses.
The honest catch: even a clean, out-of-sample, cost-included backtest is a hypothesis, not a promise. Markets change regimes — what worked in a trending year can stall in a rangebound one. The only fair claim any tested rule can make is: "it has worked so far, under these conditions, across this many trades."
The bottom line
A backtest is a rear-view mirror: essential for checking where you have been, useless as a windscreen. Treat every glossy equity curve as a claim, not a fact — ask for the out-of-sample result, the trade count, the costs and the discarded versions. And build your own forward record the same way, one honest entry at a time, with a trading journal.
TrueTrend runs on the forward-scoring idea in this post: it turns each session's market structure across Nifty, Bank Nifty and F&O into one clear, at-a-glance read — and grades its own levels in public, misses included. Create a free account and judge the record for yourself.
See these concepts on live market data — free
Create a free TrueTrend account to watch daily support/resistance levels, market regime, and option-positioning charts on NIFTY, BankNifty and 12 more instruments. Every level we publish is scored on a public scoreboard — misses included. No card required.
Free forever tier · daily levels with published hit-rates across every instrument. Descriptive market structure, not investment advice.
Not ready for an account? Get the daily levels by email.
One short email each market day — the indices' call wall, put wall, gamma flip and max pain, and how the last session's levels scored. Free, no account, unsubscribe anytime.
Descriptive market structure, not investment advice. We never share your email.