Trading Journal: What to Record and Why It Actually Works
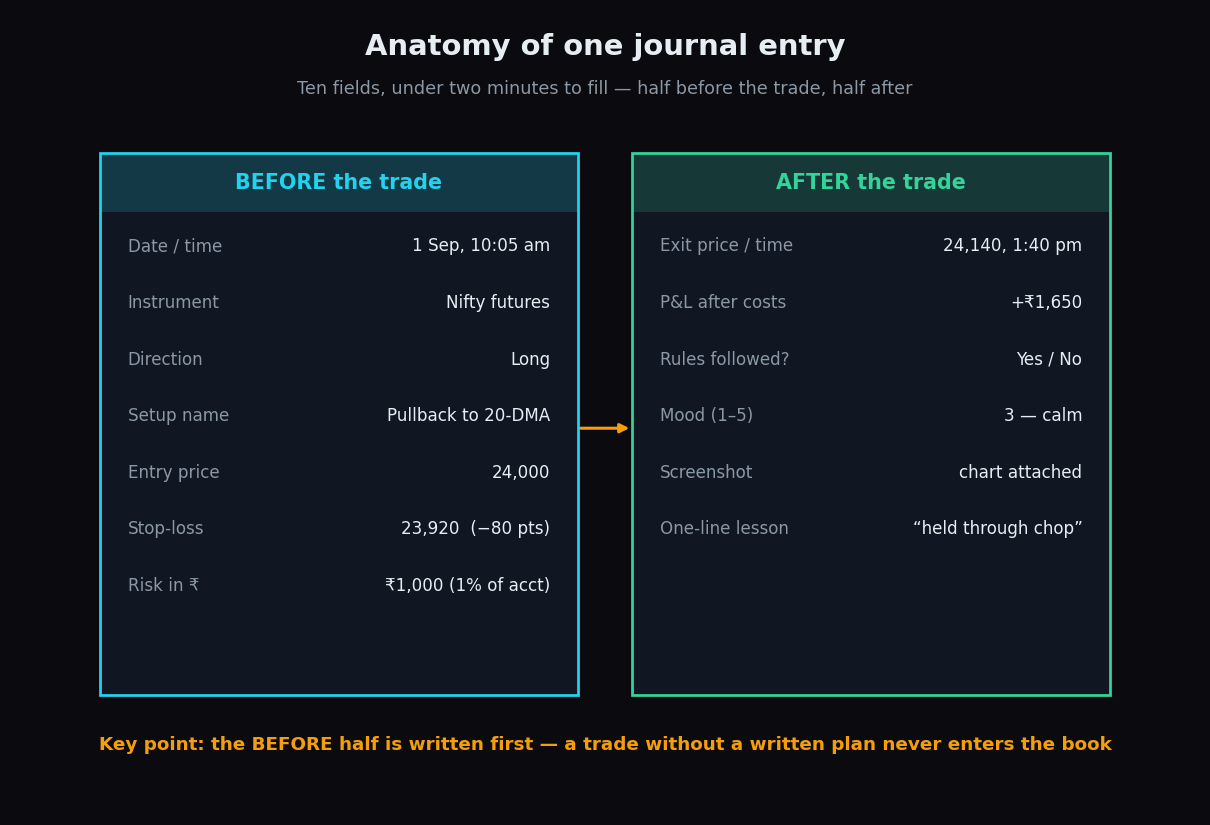
Ask a trader what the Nifty closed at yesterday and you will get the exact number. Ask the same trader what their own win rate was last month, and most will guess — usually too high. A trading journal exists to close that gap. It is the cheapest piece of trading equipment there is: a notebook or a spreadsheet, ten fields, about two minutes per trade. And in a market where roughly 9 out of 10 individual F&O traders lose money, it works on the one thing you fully control — your own behaviour.
What is a trading journal?
A trading journal is a written record of every trade you take: what you planned, what you actually did, what it cost, and how you felt while doing it. It is not the same as your broker’s trade book. The broker records what happened; the journal also records what you intended. The gap between those two is where most trading money quietly leaks away.
The everyday analogy is a food diary. People who simply write down what they eat tend to change what they eat — not because the notebook burns calories, but because writing forces a moment of honesty before and after each decision. A trading journal does the same job: it turns a blur of screen time into a small set of facts you can count.
What to record: ten fields, two minutes
Half the entry is written before the trade, half after. The before-half matters more, because it forces a plan to exist while you are still calm.
Before the trade
- Date, time, instrument, direction. What you traded and whether you went long or short.
- Setup name. The reason for the trade in two or three words — “pullback to 20-DMA”, “range breakout”. If you cannot name a setup, that is information too: the trade probably has no reason.
- Entry, stop-loss, planned exit. The price you entered, where your stop-loss sits, and the level where you plan to book the position if it works.
- Risk in rupees. Exactly how much you lose if the stop is hit. A position-sizing rule such as risking 1% of the account keeps this number boring — which is the goal.
After the trade
- Exit price and time, and P&L after costs. Costs matter more than most expect — brokerage, STT, GST and slippage can quietly eat a thin edge, so record the net figure, not the gross one.
- Rules followed: yes or no. Did the trade match the plan written above it? One honest word.
- Mood, 1–5. Calm, bored, angry, euphoric. This column looks soft; it turns out to be one of the hardest-working fields in the sheet.
- One-line lesson and, ideally, a screenshot of the chart at entry.
Why it works, part 1: memory flatters
Psychologists call it hindsight bias — the brain quietly rewrites the past so it feels more predictable and more flattering than it was. Winning trades are replayed vividly; small losses blur together and fade. Nobody is lying. Memory just is not a measuring instrument.
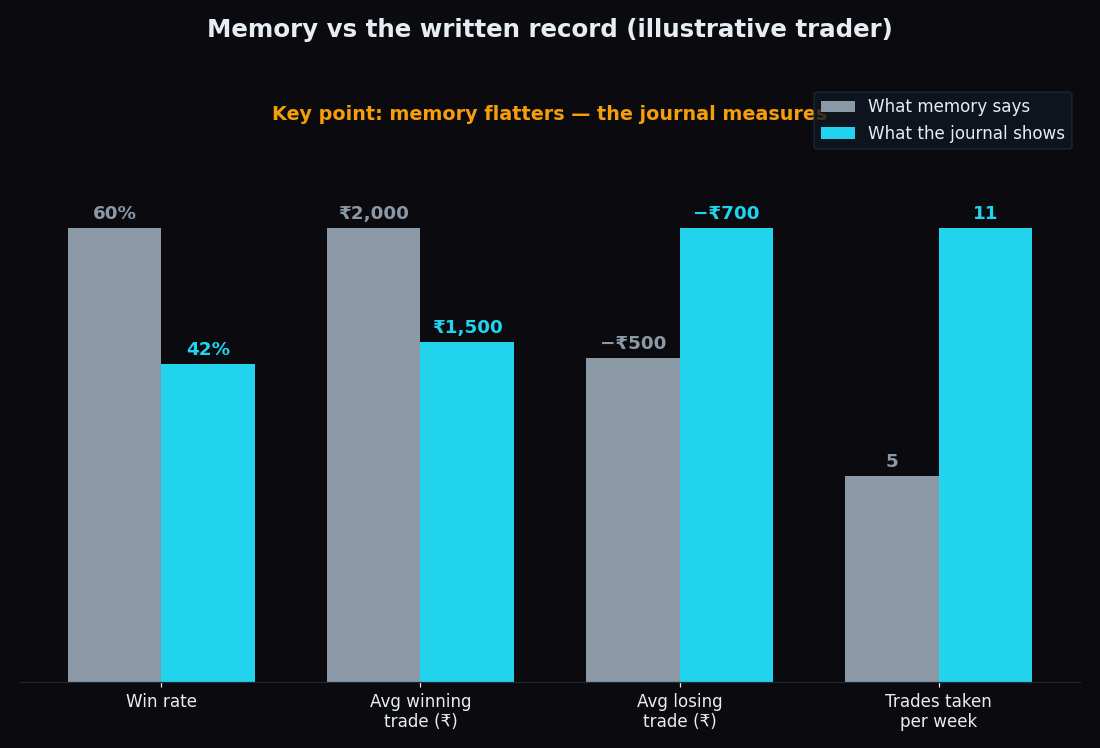
The chart above is illustrative — synthetic numbers, not portal data — but the pattern is one almost every new journal-keeper meets in the first month: the remembered win rate (60%) is far above the recorded one (42%), remembered wins are bigger than real ones, remembered losses smaller, and the number of trades actually taken is roughly double what it felt like. You cannot fix a number you have never truly seen.
Why it works, part 2: the numbers fall out
After 30–50 recorded trades, three numbers emerge on their own: your win rate (what share of trades made money), your average win, and your average loss. Together they answer the only question that matters: does this way of trading earn money per trade, on average?
A worked example with round numbers. Suppose the journal shows 20 trades: 8 winners averaging +₹1,500 and 12 losers averaging −₹700.
- Winners: 8 × ₹1,500 = +₹12,000
- Losers: 12 × ₹700 = −₹8,400
- Net: +₹3,600 over 20 trades, or about +₹180 per trade
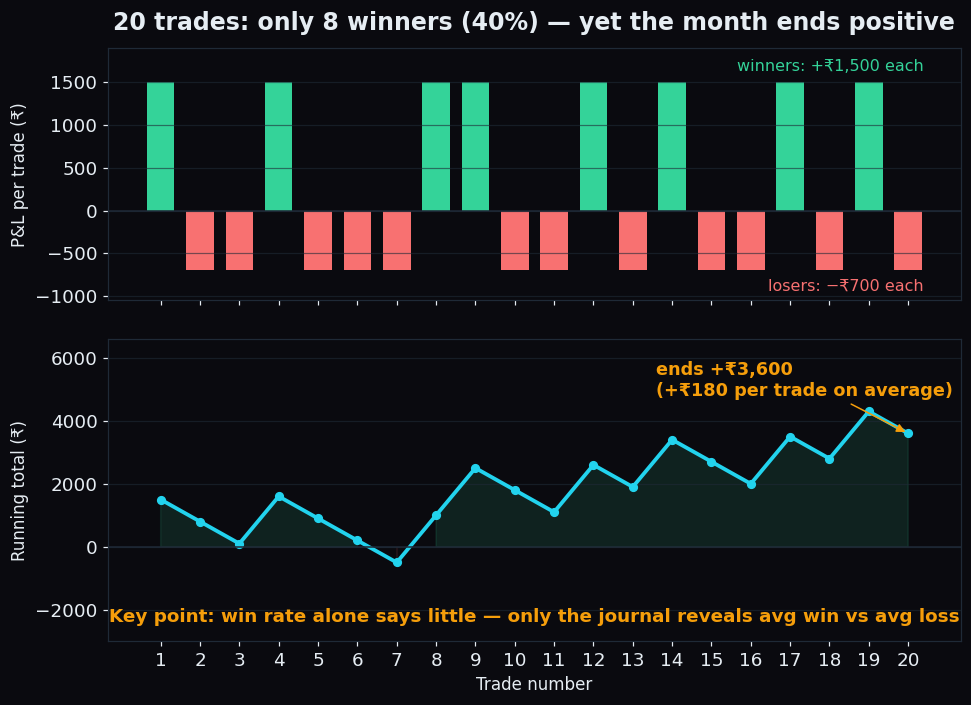
That per-trade average is called expectancy. Notice the surprise: the win rate here is only 40%, and the account still grows — because the average win is about twice the average loss. The reverse is just as true: a trader who wins 70% of the time can steadily lose money if the rare losses are huge. Win rate alone tells you almost nothing; the journal is what reveals the pair of numbers that actually decides the outcome.
The setup-name column does the same job at a finer level. Total the P&L for each named setup and it is common to find that one setup earns nearly all the money while another quietly leaks it — something no amount of screen-watching reveals.
Why it works, part 3: it catches behaviour leaks
The mood and rules columns exist to catch patterns that feel invisible in real time:
- Trades entered minutes after a stop-out, mood 4 or 5. That cluster has a name — revenge trading — and in most journals those rows are the most expensive ones on the page.
- Stops moved after entry. The plan said −80 points; the exit says −220. The journal shows how often “just a little more room” happens, and what it costs.
- Size creeping up after a winning streak. Confidence is invisible in the moment and obvious in a column of position sizes.
The simplest review of all: total the P&L of the “rules followed: yes” rows and the “no” rows separately. For most struggling traders, the yes-rows are roughly break-even or better and the no-rows carry nearly all the damage. Seeing that split once, in your own handwriting, changes behaviour faster than any lecture.
The honest catch
Three limits, stated plainly. First, a journal measures an edge; it cannot create one. If a way of trading loses money, the journal will show that clearly — which is painful, useful information, not a fix. Second, small samples mislead. Ten trades tell you almost nothing; luck dominates. Treat any number built on fewer than 30 trades as a rough sketch, and keep noting the sample size next to every figure. That habit is exactly how serious measurement works everywhere: for example, in publicly scored market data, the Nifty’s put wall — the strike carrying the heaviest put open interest — has held on about 64% of the occasions the index touched it (21 of 33 touches across 90 scored sessions, live data as of end-August 2026). The number means something because the n is shown next to it. Your journal deserves the same standard. Third, it only works if it is honest. The moment you skip recording the embarrassing trades, the instrument is broken.
A trading journal does not predict the market. It measures the trader. That is precisely the point: the market cannot be controlled — the trader can.
How to start this week
No app required. Open a spreadsheet, make ten columns matching the fields above, and fill the before-half in the moment before every entry — a trade without a written plan does not enter the book. Once a week, spend fifteen minutes on three things: the win rate / average win / average loss trio, the P&L split between rules-yes and rules-no rows, and the single worst trade of the week with its one-line lesson. Judge nothing until 30 trades are on the page. The journal will not make next week’s trades easier; it will make them visible — and visible problems are the only kind that get fixed.
A journal covers your side of the trade. For the market’s side, TrueTrend turns Nifty, Bank Nifty and F&O positioning into one clear, at-a-glance read — and scores its own record in public, losing days included. Create a free account.
See these concepts on live market data — free
Create a free TrueTrend account to watch daily support/resistance levels, market regime, and option-positioning charts on NIFTY, BankNifty and 12 more instruments. Every level we publish is scored on a public scoreboard — misses included. No card required.
Free forever tier · daily levels with published hit-rates across every instrument. Descriptive market structure, not investment advice.
Not ready for an account? Get the daily levels by email.
One short email each market day — the indices' call wall, put wall, gamma flip and max pain, and how the last session's levels scored. Free, no account, unsubscribe anytime.
Descriptive market structure, not investment advice. We never share your email.