Revenge Trading: The Psychology of Trying to Win It Back
It is 11:30 am on a Tuesday. A trader is down ₹8,000 on the day — nothing dramatic, just a stop-loss doing its job. By 3:20 pm the loss is ₹40,000, because every trade after that first one had a different goal: not to trade well, but to win it back. That shift has a name — revenge trading — and it ends more trading accounts than any bad indicator ever will.
What is revenge trading?
Revenge trading means jumping straight back into the market after a loss — bigger, faster, and with less thought — to recover the money quickly. The trade is not taken because a setup exists. It is taken because the loss hurts, and making the money back right now feels like the fastest way to stop the hurt.
Poker players have a word for this state: tilt — playing hands you would normally fold because you are still angry about the last one. It is the same instinct that makes someone feed a second, then a third coin into the claw machine that just ate their money. The machine has not changed. The player has.
Why your brain wants to get even
Three forces stack on top of each other after a loss:
- Loss aversion. Research in behavioural economics (the prospect theory work of Daniel Kahneman and Amos Tversky) suggests a loss feels roughly twice as intense as an equal-sized gain feels good. A ₹10,000 loss carries about the same emotional charge as a ₹20,000 win — so the mental books never feel balanced, even when the account says they are.
- The loss feels personal. The market is an anonymous crowd, but the brain treats a losing trade like an insult from a rival. The goal quietly switches from “follow my process” to “get back to zero today” — the same emotional hijack described in our post on fear and greed in trading.
- False urgency. The market is open right now, flickering, offering an immediate way to “fix” the feeling. Almost no other financial mistake offers a one-click rematch within seconds.
The maths quietly turns against you
A drawdown is simply how far your account has fallen from its peak. The cruel property of drawdowns is that losses and recoveries are not symmetrical: the percentage you need to gain back grows much faster than the percentage you lost.
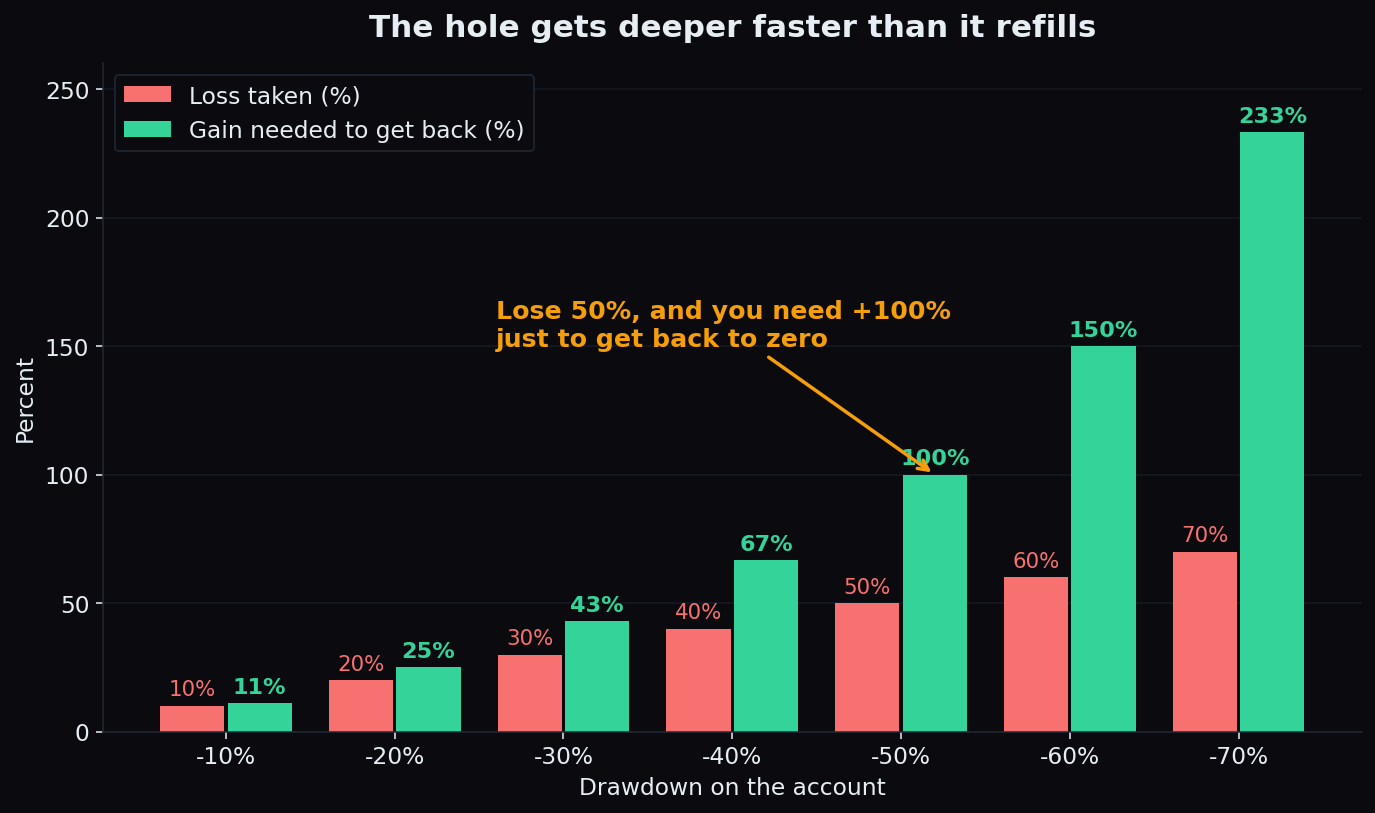
A worked example with round numbers. Start with ₹1,00,000. A bad, emotional afternoon costs 20%, leaving ₹80,000. To climb back to ₹1,00,000 you now need to make ₹20,000 on a base of ₹80,000 — a 25% gain. Lose half the account and you need a 100% gain — a double — just to reach zero. Every angry trade that deepens the hole raises the wall on the other side.
The spiral, step by step
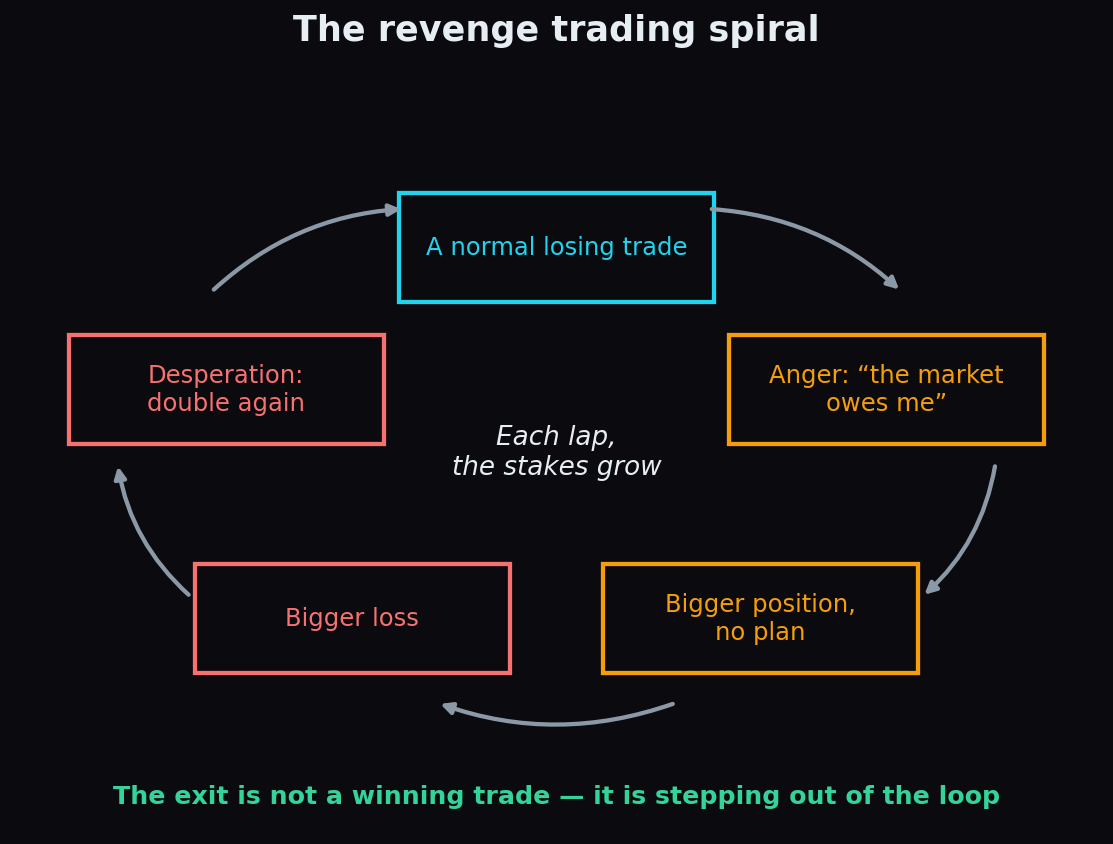
- A normal losing trade — the kind every system produces.
- Anger: “the market owes me.” The loss stops being information and becomes a score to settle.
- A bigger position, taken faster, with no real setup — because a small position cannot win it back quickly enough.
- A bigger loss, because size went up exactly when judgment went down.
- Desperation: double again. The loop repeats with higher stakes each lap.
Revenge spirals are one reason the aggregate numbers are so grim: in SEBI’s own study of individual F&O traders, roughly 9 out of 10 lost money. The exit from the spiral is never the next trade — it is stepping out of the loop.
Same trades, opposite endings
Here is a simple illustration (synthetic numbers, not market data). Two traders take the identical sequence of 18 trades — same wins, same losses, ending with a six-trade losing streak. Trader A risks a fixed 2% of the account on every trade. Trader B doubles the risk after every loss to win it back faster.
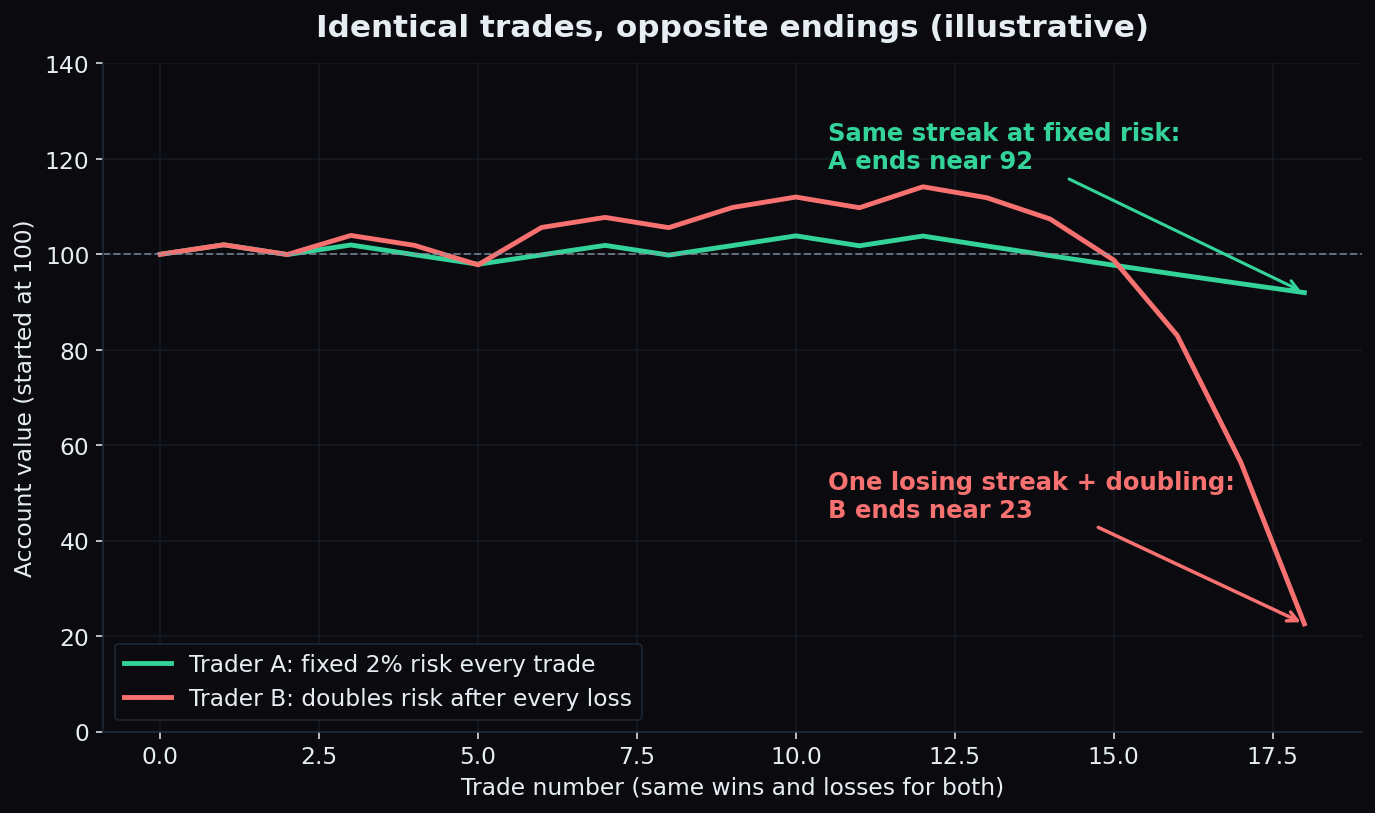
For most of the sequence, doubling even looks clever — each streak ends, and the doubled position claws the money back. Then one streak runs longer than the others, and the account that was risking 2% per trade finishes around 92, while the doubling account collapses to about 23. Doubling after losses does not remove risk; it saves it up and spends it all on the worst week.
Warning signs you are on tilt
- The size of your next trade is decided by the size of your last loss, not by your plan.
- You feel you cannot end the day red — being flat by 3:30 pm has become the mission.
- Trades are entered within minutes of a stop-out, without a fresh setup.
- You catch yourself thinking the market, or “they”, did something to you personally.
- You have stopped noting trades down because you do not want to see them.
Rules that break the loop
Emotion cannot be argued with in the moment, so the traders who survive this pattern put rules in place before the moment arrives:
- A daily loss limit. A fixed amount — say 2% of the account — after which the platform is closed for the day. Decided on a calm day, obeyed on a bad one.
- A cooldown after every stop-out. Even 15 minutes away from the screen lets the chemical spike of the loss fade before the next decision.
- Fixed position sizing. When size is set by a position-sizing rule instead of by mood, a loss cannot vote on the next trade.
- An exit defined before entry. A stop-loss placed at entry time converts a loss from a shock into a planned cost.
- A written journal. One line per trade: setup, size, result, mood. Revenge trades struggle to survive being written down.
A losing trade only becomes a disaster when it changes how you trade for the rest of the day. The loss is the cost of doing business; the revenge is optional.
A real edge loses often — expect it
Part of the cure is expecting losses in the first place. Even measured, publicly scored market tendencies fail regularly. For example, on the Nifty, the strike carrying the heaviest put open interest — the put wall — has held on 69% of the sessions where the index touched it (n=29 touches, live scored data as of mid-August 2026). That is a genuinely useful tendency — and it still fails roughly 3 times in 10. If a scored, data-backed level fails that often, a trade taken in anger has no right to expect certainty.
This is exactly the moment TrueTrend is built for: instead of trading the feeling, you can see how Nifty, Bank Nifty and the F&O crowd are actually positioned — as one clear, at-a-glance read, scored in public, losing days included. See the live scoreboard.
See these concepts on live market data — free
Create a free TrueTrend account to watch daily support/resistance levels, market regime, and option-positioning charts on NIFTY, BankNifty and 12 more instruments. Every level we publish is scored on a public scoreboard — misses included. No card required.
Free forever tier · daily levels with published hit-rates across every instrument. Descriptive market structure, not investment advice.
Not ready for an account? Get the daily levels by email.
One short email each market day — the indices' call wall, put wall, gamma flip and max pain, and how the last session's levels scored. Free, no account, unsubscribe anytime.
Descriptive market structure, not investment advice. We never share your email.