How China's Economy Moves Indian Markets: Supply Chains, Metals and Flows
India does not trade much with China's stock market, but it trades a great deal with China's factories. In the financial year 2024–25, India imported goods worth more than $110 billion from China and exported only about $14 billion back, according to Ministry of Commerce data. That gap of close to $100 billion is the largest India runs with any country. It is the first clue to why a factory slowdown in Guangdong or a stimulus announcement in Beijing can move stocks on the NSE within hours.
The analogy: one factory, one kitchen, one wallet
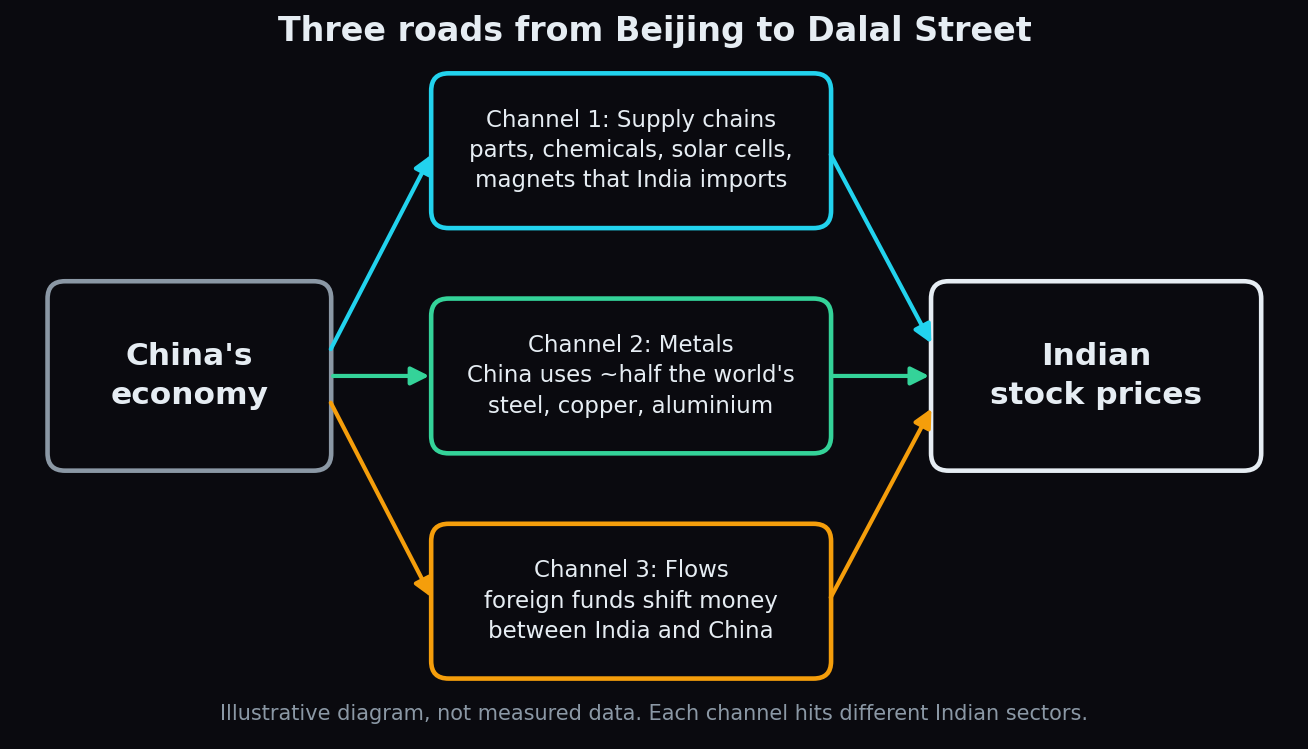
Think of the world economy as a large apartment building. China runs the building's factory floor: it makes many of the parts everyone else assembles. China also runs the biggest kitchen: it eats roughly half of the world's steel, copper and aluminium, so what China orders sets the price for everyone. And both China and India live off the same wallet: the pool of foreign money that global funds spread across emerging markets.
Those are the three channels this post walks through. Each one reaches a different corner of the Indian market, and each has an honest limit.
Channel 1: supply chains, or what India cannot yet make at home
A supply chain is the list of everything that has to arrive before a product can leave the factory. For a large share of what India builds, an important link in that chain sits in China. A few examples that matter for listed companies:
- Pharma inputs. India is famous for cheap generic medicines, but around 70% of the bulk chemicals those medicines are made from (called APIs, active pharmaceutical ingredients) are imported, mostly from China.
- Electronics. Phones and TVs are increasingly assembled in India, but displays, chips, batteries and many small components still come in from China.
- Solar. Solar cells and modules for India's power build-out have long been sourced from Chinese makers, which is why import duties and "approved list" rules keep changing.
- Rare-earth magnets. Electric two-wheelers and cars need small, powerful magnets. When China restricted exports of several rare-earth materials in April 2025, Indian auto makers publicly warned of production risk within weeks.
Why does this move stocks? Because a disruption in China does not just hurt Chinese companies. It raises input costs, delays deliveries and squeezes profit margins for Indian firms that never appear in a headline about China. The market prices that in fast, usually sector by sector rather than across the whole index.
There is a second side to this channel that works in India's favour. When global companies decide they rely too heavily on one country, they look for a second base. This is often called "China plus one". The most visible example is smartphone assembly shifting to India. Investors watch this because it can lift earnings for electronics manufacturers, industrial parks and logistics firms over years, not days.
Channel 2: metals, where China sets the price
Steel, copper, aluminium and zinc are traded worldwide, and China is by far the largest single consumer of each. So when Chinese construction slows, as it did through its long property downturn, global metal prices fall. When Beijing announces spending on roads, rail or housing, they rise.
India's metal companies do not need a single Chinese customer to feel this. Their products are priced off the same global benchmarks. That is why the Nifty Metal index is one of the most China-sensitive parts of the Indian market: it can rally on a Chinese stimulus headline and slump on a weak Chinese factory survey, even when nothing has changed in India.
There is a sharper version of the problem. When China's own demand is weak, its mills keep producing and ship the surplus abroad at low prices. Indian producers then face cheaper imports at home. In 2025 India responded with a 12% safeguard duty on certain steel imports, a policy move that itself moved metal stocks on the day it was announced.
A worked example with simple numbers
Imagine a steel plant that prices its steel at ₹60,000 a tonne and spends ₹50,000 a tonne making it. Profit: ₹10,000 a tonne.
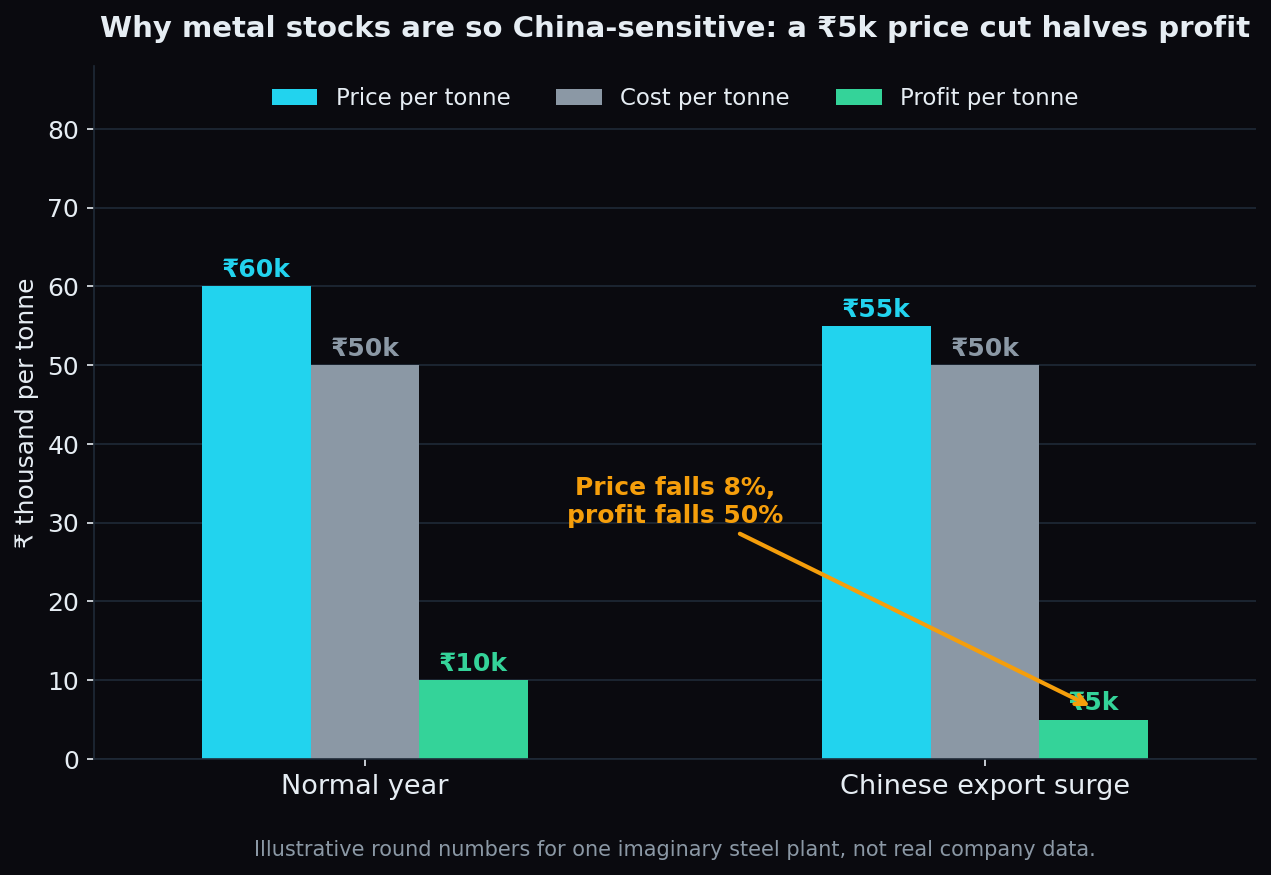
Now a surge of cheap Chinese exports pulls the local price down to ₹55,000. Costs do not move. Profit is now ₹5,000 a tonne. The price fell about 8%, but profit fell 50%. That lopsided arithmetic is called operating leverage: when costs are mostly fixed, small price moves become big profit moves. It explains why metal stocks swing so hard on Chinese news, in both directions.
Channel 3: flows, where India and China share one wallet
Global fund managers rarely choose "India or nothing". Most run emerging-market portfolios where India and China are the two largest weights. Together they make up roughly half of the widely tracked MSCI Emerging Markets index. When one looks more attractive, money tends to shift from the other. This is the channel that moves the whole Nifty, not just one sector.
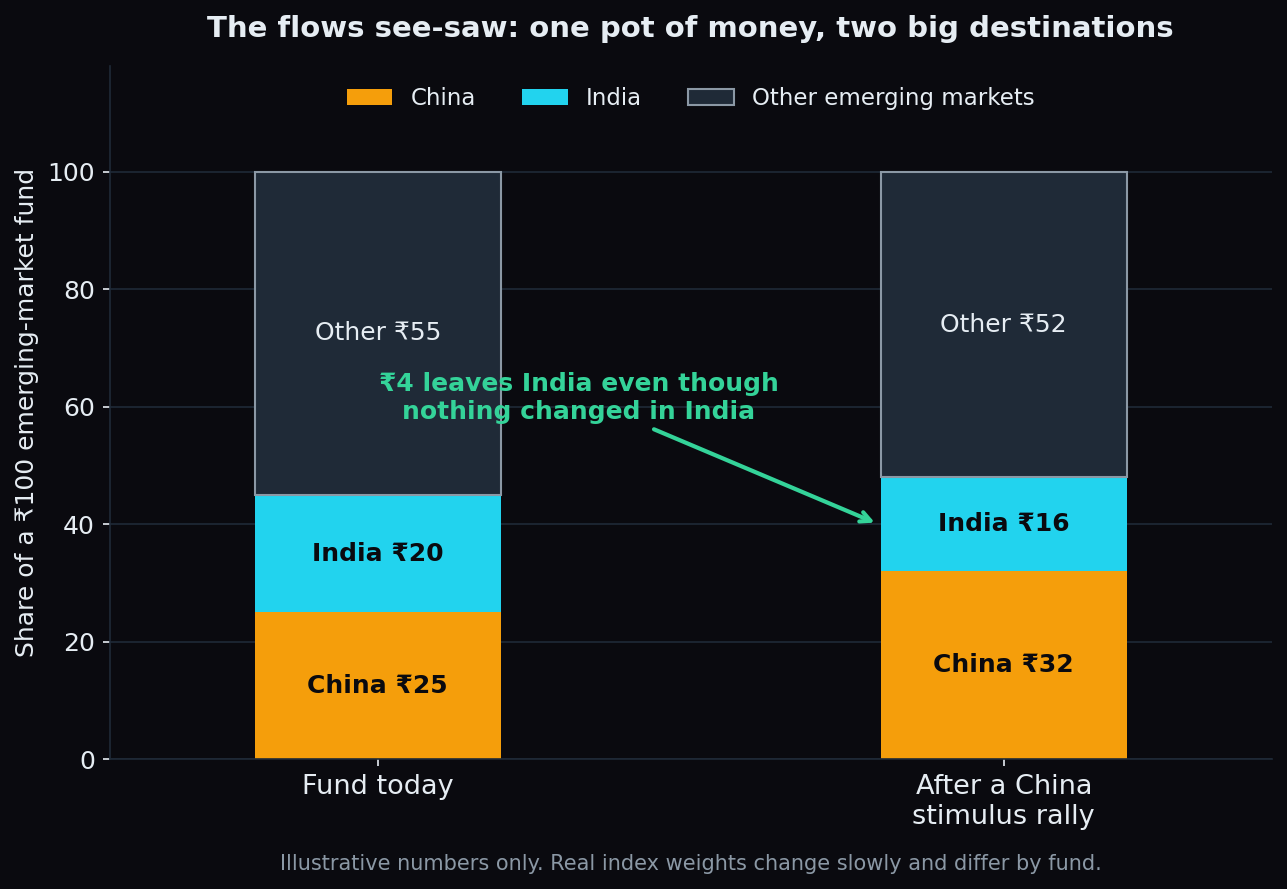
Picture a fund with ₹100 spread across emerging markets: ₹25 in China, ₹20 in India, ₹55 elsewhere. China announces a large stimulus package and its stocks look cheap. The manager moves to ₹32 in China and ₹16 in India. Nothing changed in India, yet ₹4 left. Scale that across thousands of funds and you get a wave of foreign outflows from Mumbai.
This is not theory. In late September 2024, China unveiled a broad stimulus push and Chinese stocks jumped. In October 2024, foreign portfolio investors sold a net of roughly ₹94,000 crore of Indian shares, the largest monthly outflow on record at the time. Dealing rooms called it the "shift to China" trade. Our post on who really moves Indian markets, FIIs or DIIs explains why that month hurt less than it once would have: domestic funds absorbed much of that outflow.
The reverse also happens. Through 2022 and 2023, worries about China's property sector and regulation pushed money towards India, which supported Indian valuations even as Chinese indices lagged.
The relationship is old: the 2015 lesson
None of this is new. On 24 August 2015, after China let its currency weaken and its stock market tumbled, the Sensex fell close to 6% in a single session, one of its worst days in years. Indian companies had not changed overnight. What changed was global risk appetite, and the fear that a slowing China would drag world growth, commodity prices and emerging-market currencies down together. That episode is the template for how a China shock reaches India: through sentiment first, and through earnings much later, if at all.
Which Indian sectors feel China most
- Metals and mining: highest sensitivity, through global prices and import competition.
- Chemicals and pharma: input costs and, in some cases, direct competition from Chinese producers.
- Autos and electronics: parts, batteries and magnets in the supply chain.
- Capital goods and infrastructure: can benefit from the "China plus one" shift over time.
- Banks, IT services, FMCG: low direct exposure; they move on China mainly through the flows channel.
Notice that the biggest Nifty weights, banks and IT, sit in the last bucket. This is why India's index correlation with China tends to be episodic: strong on shock days, weak most of the rest of the time. Our explainer on sector rotation covers how money moves between these groups.
The honest catch
- India is mostly a domestic story. Consumption and government spending drive Indian GDP far more than exports. A Chinese slowdown dents Indian earnings much less than it dents Korea's or Taiwan's.
- Chinese data is hard to read. Official statistics are released on China's schedule and often revised. Markets react to surveys and headlines, which means false alarms are common.
- Flows are about relative attractiveness, not China alone. A rush into China often coincides with a stronger US dollar or higher US yields, which hit India through the rupee anyway. Blaming China for a bad month is usually only half right.
- Capital links are thin by design. Since 2020, foreign direct investment from countries sharing a land border with India needs government approval, and Chinese portfolio money in Indian stocks is negligible. The connection runs through goods and sentiment, not through ownership.
Key takeaway: China reaches Indian markets through three roads: the parts India imports, the metal prices China sets, and the foreign money both countries compete for. The first two hit specific sectors; the third moves the whole index. On most days the link is loose. On shock days it is the only thing that matters.
So the next time a China headline flashes, ask which road it is travelling on. A weak factory survey is a metals story. A rare-earth export rule is an autos and electronics story. A big stimulus package is a flows story, and the one most likely to show up in the Nifty's close.
Global cues are one input; positioning is another. TrueTrend turns daily market structure across Nifty, Bank Nifty and F&O into a clear, at-a-glance read, and scores its own record in public on the scoreboard. Create a free account to see today's picture.
See these concepts on live market data — free
Create a free TrueTrend account to watch daily support/resistance levels, market regime, and option-positioning charts on NIFTY, BankNifty and 12 more instruments. Every level we publish is scored on a public scoreboard — misses included. No card required.
Free forever tier · daily levels with published hit-rates across every instrument. Descriptive market structure, not investment advice.
Not ready for an account? Get the daily levels by email.
One short email each market day — the indices' call wall, put wall, gamma flip and max pain, and how the last session's levels scored. Free, no account, unsubscribe anytime.
Descriptive market structure, not investment advice. We never share your email.