FII vs DII: Who Really Moves Indian Markets?
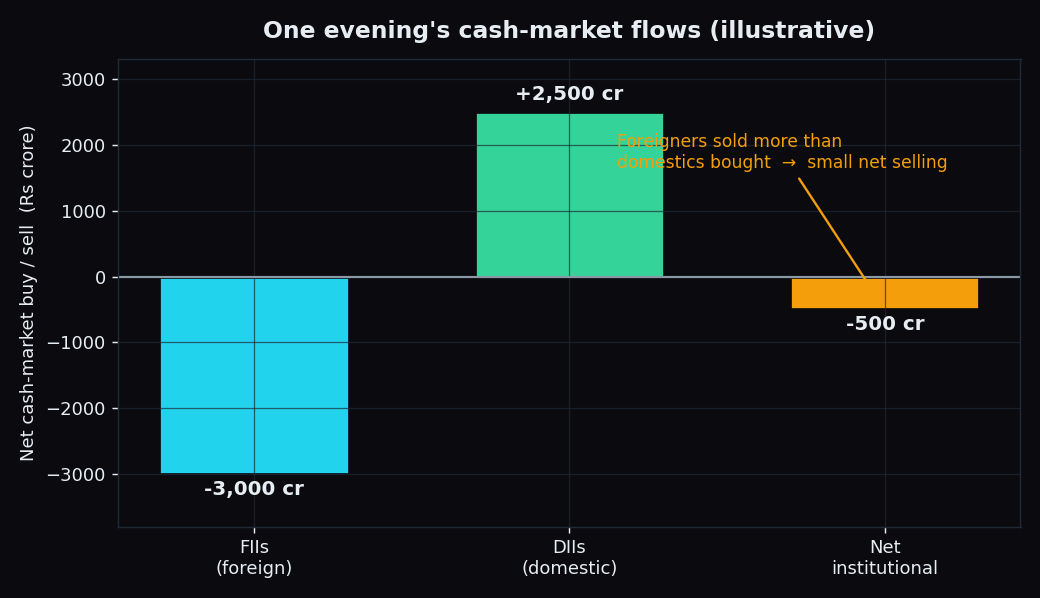
Every trading evening, after the closing bell, India’s exchanges publish two numbers that traders refresh like a cricket score: how much the FIIs bought or sold, and how much the DIIs bought or sold. One line can read ₹3,000 crore sold, the next ₹2,500 crore bought. These are the daily FII/DII flows — the closest thing the market has to a scoreboard of who pushed and who pulled that day. This guide explains what those two numbers are, who tends to set the trend, and how to read them without reading too much into them.
Who are the FIIs and DIIs?
An FII is a Foreign Institutional Investor — a large pool of money managed from outside India, like a global pension fund, a sovereign wealth fund, or an international asset manager that buys Indian shares. Under SEBI’s current rules these are formally called FPIs (Foreign Portfolio Investors), but the market still says “FII” out of long habit.
A DII is a Domestic Institutional Investor — a large Indian institution putting money to work at home: mutual funds (where your monthly SIP lands), insurance companies such as LIC, banks, and pension funds.
The key word in both is institutional. These players trade in enormous size — hundreds or thousands of crore in a single day — so when they move together, the whole market, including every major index, feels it. A single retail order does not.
Picture the market as a giant tug of war, with the index as the flag in the middle of the rope. Foreign money pulls from one side; domestic money pulls from the other. When one side heaves harder, the flag — the index — slides their way. Most days both sides pull hard at once and the flag barely moves. The daily FII/DII figures are simply the referee’s note of how hard each side pulled.
The daily numbers, decoded
Here is what a typical evening print looks like, with clean round numbers to keep it simple:
- FIIs: ₹3,000 crore sold in the cash market — foreigners were net sellers.
- DIIs: ₹2,500 crore bought — domestic institutions were net buyers.
- Net institutional flow: ₹500 crore sold (2,500 bought minus 3,000 sold).
Two things to keep straight. First, these are cash-market (actual-shares) figures, and the version you see the same evening is provisional — the exchanges revise it the next day once everything is reconciled. Second, neither line means much on its own; what matters is the net pull and which way it leans against the recent trend.
One more distinction trips up beginners: this evening figure covers the cash segment only — real shares changing hands. It is not the same as what FIIs are doing in futures & options, where they may be hedging or positioning in the opposite direction. If derivatives positioning is new to you, start with what open interest is and why it matters.
Who really sets the trend?
Over the years, FIIs have tended to be the swing vote on direction. Their money is global and mobile, so it flows in and out with worldwide risk appetite, US interest rates, and the value of the rupee. When foreign money floods in, big-cap indices tend to lift; when it rushes out, they tend to sag. That is why FII flows sit alongside global cues like how the US market’s overnight move sets India’s tone and the rupee’s link to stocks.
DIIs are the counterweight — the shock absorber. Because crores of SIP money arrive every single month, domestic funds have a near-constant stream of cash to deploy, and they often buy when foreigners sell. That steadiness is what keeps a heavy FII sell-off from turning into a rout.
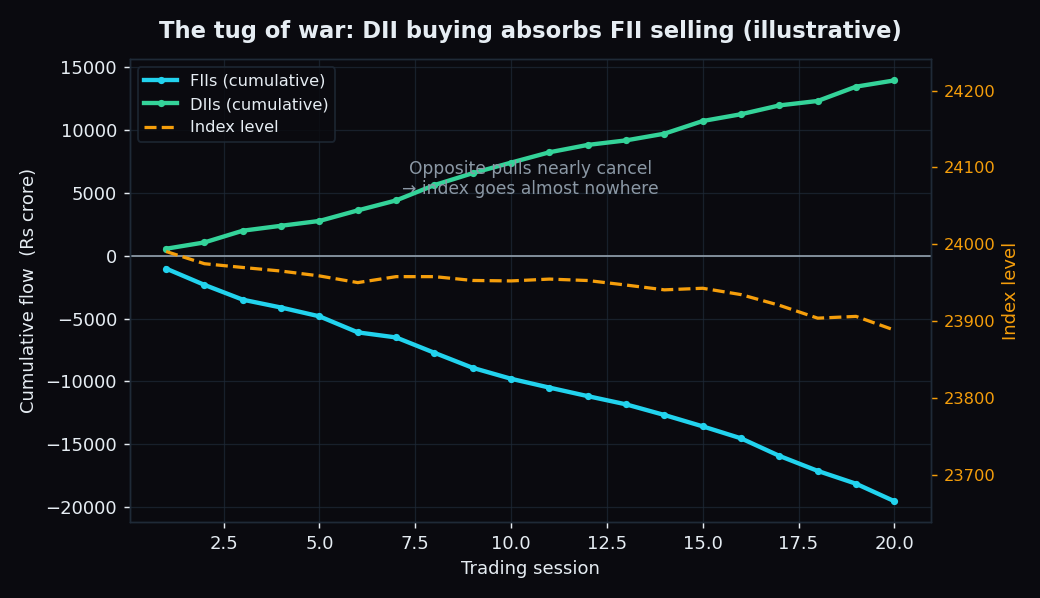
That is the tug of war in one picture: foreign money pulling one way, domestic money pulling the other, and the index going almost nowhere because the two forces roughly cancel. In recent years the domestic cushion has grown large enough that stretches of heavy FII selling no longer sink the market the way they once did — a genuine shift in market structure worth checking against current exchange data, since the balance keeps evolving.
How to read the daily flows
Treat the evening figures as a record of what happened, not a crystal ball. A few descriptive habits help:
- One day is noise. A single evening’s number swings around for all sorts of reasons — an index rebalance, one large block deal, an expiry. The drift over several days or weeks carries the real information.
- Watch the net, and the direction. ₹3,000 crore of FII selling fully absorbed by DII buying is a very different day from the same selling with domestic funds also stepping back.
- Cash is not the whole story. Pair the cash figure with what you can see in derivatives positioning before drawing conclusions.
- Provisional first, final later. Same-evening numbers get revised; don’t build a firm view on the first print.
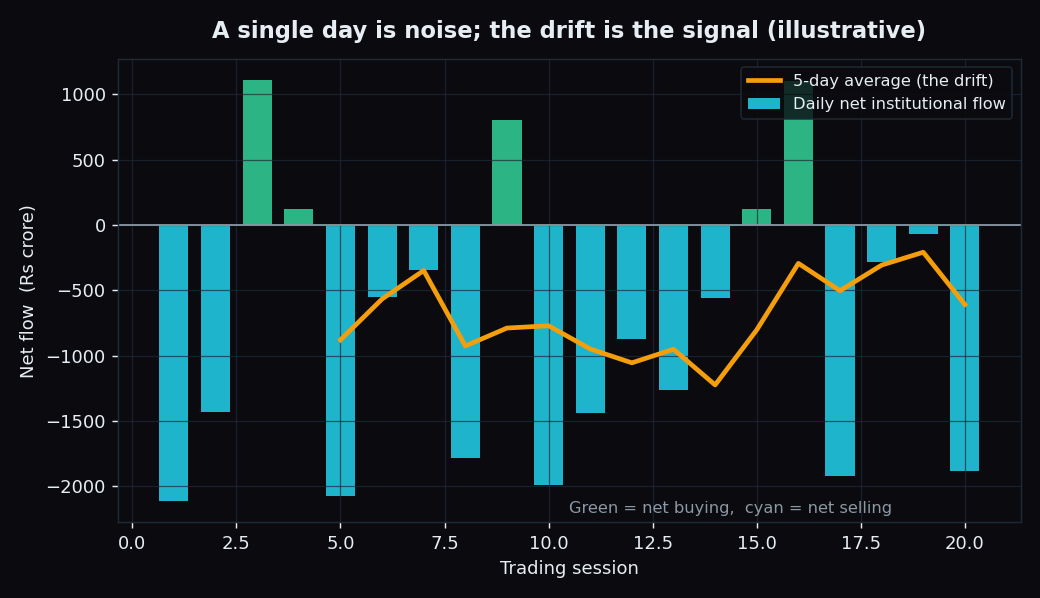
The chart above is the whole lesson in one frame: the daily bars jump around noisily, but the smooth five-day average quietly reveals the underlying drift. The bars are the mood; the line is the message.
The honest catch
It is tempting to see a big FII sell number and treat it as a reason to act. The data argues for humility. Flows explain the market’s past pressure well; they forecast its next move poorly, because price is set by many forces at once — earnings, global rates, currency, positioning, and plain sentiment.
Our own measured data shows how stubbornly the market resists single-cause prediction. On the public scoreboard, the Nifty closed within one strike of its max-pain level — the option market’s single strongest “gravity” point — in only 40% of 53 scored sessions, and Bank Nifty in just 10% of 52. If the most-watched magnet in the entire option market pins the close only a minority of the time, no single evening’s flow figure is going to hand you tomorrow’s direction.
Key takeaway: FII and DII figures tell you who was pushing and who was pulling today — they are a record, not a forecast. The drift over weeks matters far more than any single evening’s number, and no one input decides the close on its own.
TrueTrend turns this kind of market-structure read — where the big money is positioned across Nifty, Bank Nifty and F&O — into one clear, at-a-glance picture, and scores how its own levels actually played out, in public. See the daily read on TrueTrend.
See these concepts on live market data — free
Create a free TrueTrend account to watch daily support/resistance levels, market regime, and option-positioning charts on NIFTY, BankNifty and 12 more instruments. Every level we publish is scored on a public scoreboard — misses included. No card required.
Free forever tier · daily levels with published hit-rates across every instrument. Descriptive market structure, not investment advice.
Not ready for an account? Get the daily levels by email.
One short email each market day — the indices' call wall, put wall, gamma flip and max pain, and how the last session's levels scored. Free, no account, unsubscribe anytime.
Descriptive market structure, not investment advice. We never share your email.