Cyclical vs Defensive Sectors: How the Economy Picks Leaders
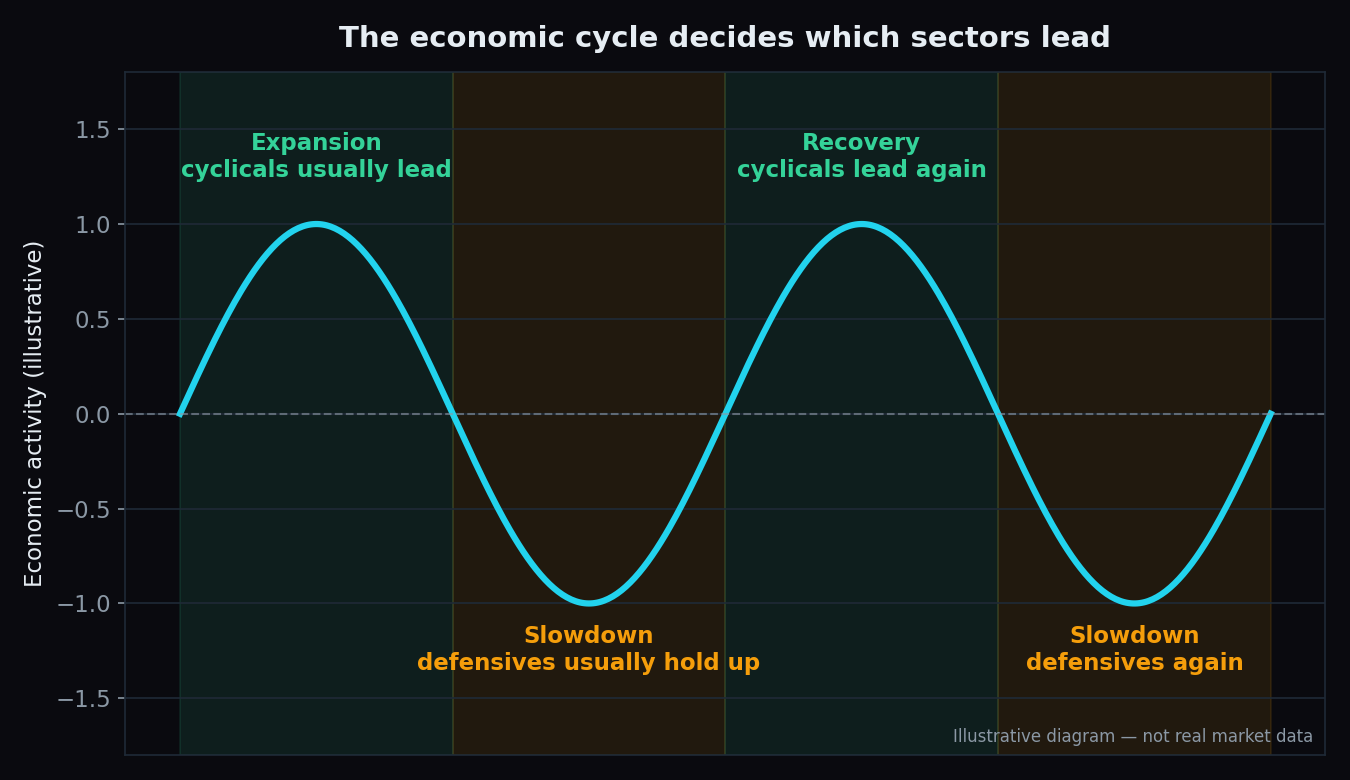
When the Indian economy is booming, car showrooms are crowded, banks hand out more loans, and steel plants run flat out. When it slows, those same businesses struggle — yet people still purchase toothpaste, medicines, and electricity. That one difference, between spending people can postpone and spending they cannot skip, is the whole idea behind cyclical and defensive sectors — and it quietly decides which stocks lead the market in each phase.
First, what is a sector?
A sector is a group of companies in broadly the same line of business. On the NSE, listed companies are grouped into sectors like autos, banks, FMCG (fast-moving consumer goods — everyday items like soap, biscuits, and toothpaste), pharma, metals, and IT. Each group has its own index, such as Nifty Auto or Nifty FMCG, which tracks that group the same way a market index tracks the whole market.
Cyclical sectors: profits that ride the economy
A cyclical sector is one whose sales and profits rise and fall with the economic cycle — the repeating rhythm in which the economy grows quickly for a few years (an expansion), then grows slowly or shrinks (a slowdown or contraction), and then recovers again.
In India, the classic cyclicals are:
- Autos — a new car or bike is the easiest purchase to postpone.
- Banks and NBFCs — loan growth and repayment health both track the economy.
- Metals and mining — steel and aluminium demand follows construction and manufacturing.
- Cement and real estate — people build when incomes feel secure.
- Capital goods — machinery orders arrive when factories are expanding.
- Hotels and airlines — travel is one of the first budgets cut in a squeeze.
Two forces make their profits swing so hard. First, their demand is discretionary — customers can delay it without real pain. Second, they carry operating leverage: a big share of their costs (factories, machines, salaries) stays the same whether they produce a lot or a little. So when sales rise, profit rises much faster — and when sales fall, profit collapses much faster too.
Defensive sectors: demand that never switches off
A defensive sector is one whose demand stays roughly steady no matter what the economy does. People do not skip soap, medicines, or electricity in a slowdown.
- FMCG — daily essentials with small ticket sizes.
- Pharma and healthcare — illness does not wait for GDP data.
- Utilities — power and gas bills get paid in every phase of the cycle.
One Indian nuance: IT services are often treated as defensive because of their steady contracts and cash flows. But Indian IT earns most of its revenue from US and European clients, so it follows their spending cycle rather than India's. It can behave defensively in an Indian slowdown and cyclically in a global one — a reminder that the labels describe demand, not a fixed list of names.
An everyday analogy: the ice-cream stall and the pharmacy
Picture two shops on the same street. The ice-cream stall has amazing months in summer and dead months in the monsoon — its earnings depend on conditions it does not control. The pharmacy next door does roughly the same business every single month. Neither shop is "better"; they are different kinds of businesses. Cyclical stocks are the ice-cream stall. Defensive stocks are the pharmacy. The economy is the weather.
A worked example with simple numbers
Take two companies that each earn a profit of ₹100 crore in a normal year: a car maker and a toothpaste maker.
- Boom year: households upgrade their cars, so the car maker's profit jumps to ₹160 crore. Toothpaste demand barely changes: ₹110 crore.
- Slow year: car purchases get postponed, but the car maker's factories and salaries still cost the same — profit crashes to ₹55 crore. The toothpaste maker slips only to ₹95 crore.
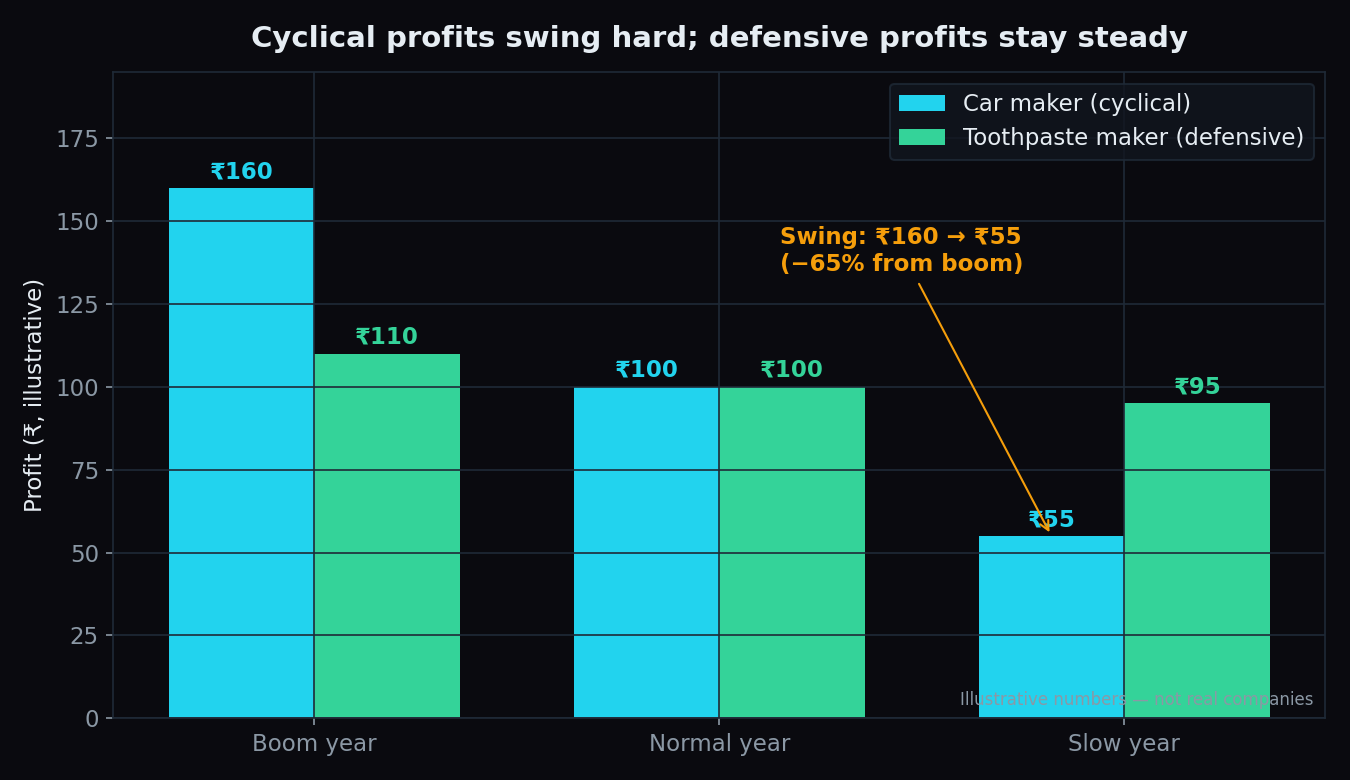
The car maker's profit swung from ₹160 crore to ₹55 crore — a fall of about 65% from the boom. The toothpaste maker moved within a narrow ₹95–₹110 band. Because stock prices follow expectations of future profit, the cyclical stock tends to swing far more in both directions. The same company can look like a hero one year and a laggard the next without doing anything wrong — the cycle did it.
How the economy picks the leaders
Markets are forward-looking, so leadership tends to shift with the phase of the cycle:
- Recovery and expansion: cyclical profits accelerate off a low base, and operating leverage turns modest sales growth into big profit growth. Cyclicals usually lead.
- Peak and slowdown: cyclical profits decelerate first. Money drifts toward businesses whose earnings will not crack — defensives usually fall less and therefore "lead" in relative terms.
This is also why the stock market and GDP data often seem out of sync: prices move on where the cycle is heading, while official data describes where it was. We cover that gap in GDP and the stock market.
What the rotation looks like
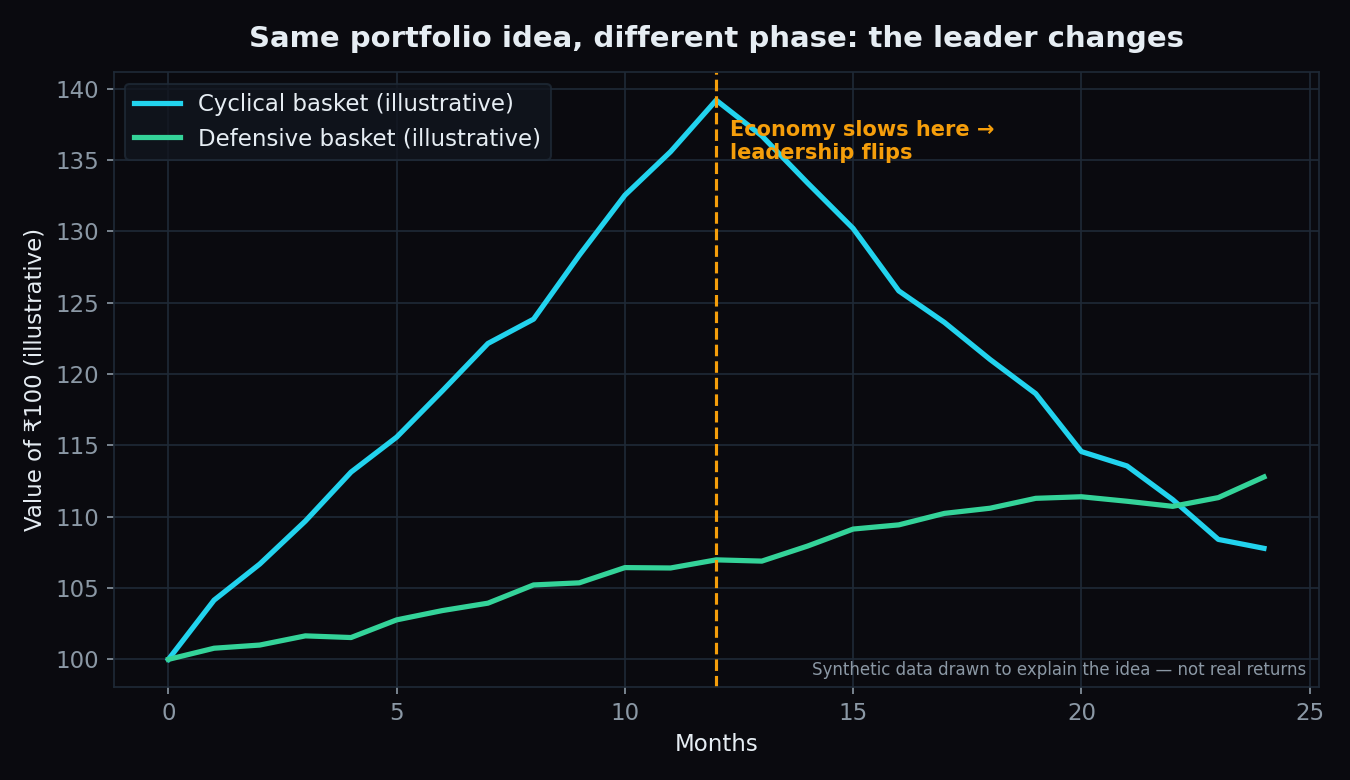
When large investors shift money from one group of sectors to another as the cycle turns, it is called sector rotation. On a chart it looks like the picture above: the cyclical basket races ahead while the economy accelerates, then hands the lead to the steady defensive basket once growth rolls over. The overall index can look calm while a violent leadership change happens underneath it. We explain the mechanics in sector rotation explained.
The honest catch
- The labels are fuzzy. Banks are cyclical but also ride India's long-term credit growth; IT depends on the US cycle; some "defensive" FMCG names have cyclical rural demand. Treat the labels as a spectrum, not two boxes.
- The flip is only obvious in hindsight. GDP and earnings data arrive with a lag of months. By the time a slowdown is official, prices have usually moved already.
- Defensives are "less bad", not safe. In a sharp market-wide crash, almost everything falls — defensives usually just fall less. Steady demand is not the same as a steady stock price.
- Cycles have no fixed timetable. An expansion can run two years or ten. There is no assurance the historical pattern repeats on schedule.
Key takeaway: the market does not reward the "best" company every year — it rewards the group whose profits are accelerating. Knowing whether a business is cyclical or defensive tells you what kind of ride to expect. It does not tell you the dates.
Watching the leadership change in real time
Sector labels are the theory; positioning is the live evidence. Index and F&O data show where money is actually rotating long before the GDP print confirms the story.
Want the live picture instead of the theory? TrueTrend turns index, F&O, and positioning data into a clear, at-a-glance read across Nifty and Bank Nifty — with a track record scored in public, not claimed in private. Create a free account and see today's read.
See these concepts on live market data — free
Create a free TrueTrend account to watch daily support/resistance levels, market regime, and option-positioning charts on NIFTY, BankNifty and 12 more instruments. Every level we publish is scored on a public scoreboard — misses included. No card required.
Free forever tier · daily levels with published hit-rates across every instrument. Descriptive market structure, not investment advice.
Not ready for an account? Get the daily levels by email.
One short email each market day — the indices' call wall, put wall, gamma flip and max pain, and how the last session's levels scored. Free, no account, unsubscribe anytime.
Descriptive market structure, not investment advice. We never share your email.