F&O Ban Period and MWPL Explained: Why Some Stocks Get Locked Out
Some mornings, the NSE puts out a short list of stocks with a warning attached: these names are in the F&O ban period. If a stock is on that list, nobody — not you, not a large fund — may open a fresh futures or options position in it that day. Existing positions can only be closed or reduced. This post explains the rule behind that list: MWPL, the 95% trigger, and the 80% exit.
First, two quick definitions
F&O is short for futures and options — contracts whose value comes from an underlying stock. If those are new to you, start with our plain-English guide to what derivatives are.
Open interest (OI) is the number of F&O contracts currently open — created but not yet closed. It measures how much outstanding exposure exists in a stock's contracts at any moment. We cover it in detail in open interest explained.
MWPL: a parking lot for positions
MWPL stands for market-wide position limit. For every stock in the F&O segment, the exchanges set a cap on the total open interest allowed across all of its futures and options contracts, on all exchanges combined. The cap is linked to the stock's free float (the shares not held by promoters) and to how actively the stock really trades — SEBI revised the exact formula in 2025, but the idea is unchanged: the derivative bets on a stock should not dwarf the real, tradeable stock underneath them.
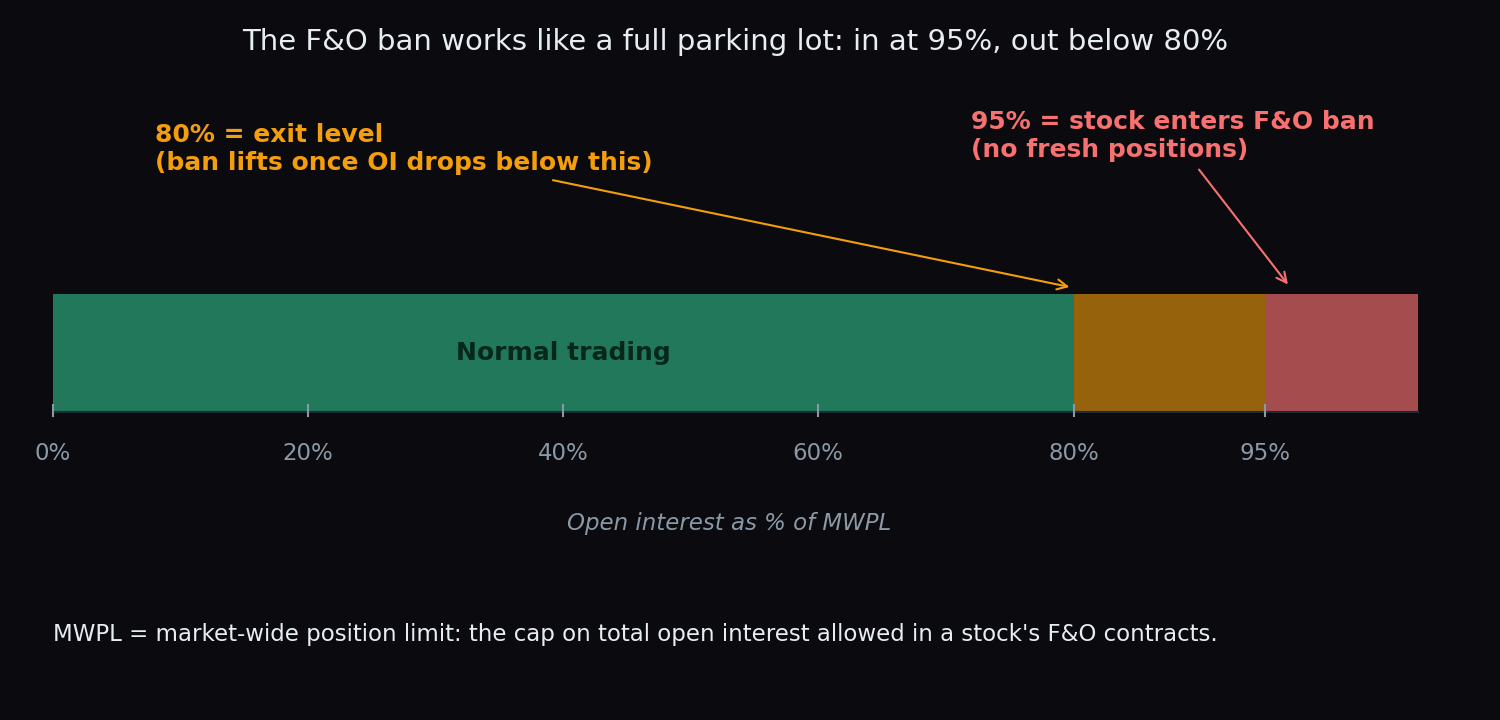
The easiest way to picture MWPL is a parking lot. The lot has a fixed number of spaces (the MWPL). Every open F&O position is a parked car. When the lot is 95% full, the guard shuts the entry gate: cars already inside can leave whenever they like, but no new car gets in until the lot empties out to below 80% full.
The 95% rule: how a stock enters the ban
At the end of each trading day, the exchanges add up the open interest in a stock's futures and options across exchanges. If that combined OI crosses 95% of the stock's MWPL, the stock goes into the F&O ban from the next trading session. The exchange publishes the ban list before the market opens, so everyone knows which names are locked before the first trade.
A worked example with round numbers
Say a stock's MWPL works out to 20 crore shares. (OI is counted in the shares underlying the contracts — one futures lot of 500 shares adds 500 to the tally. Curious how lots work? See lot size and contract value.)
- Combined OI = 18 crore shares → 90% of MWPL → trading is normal, but the stock is close to the trigger.
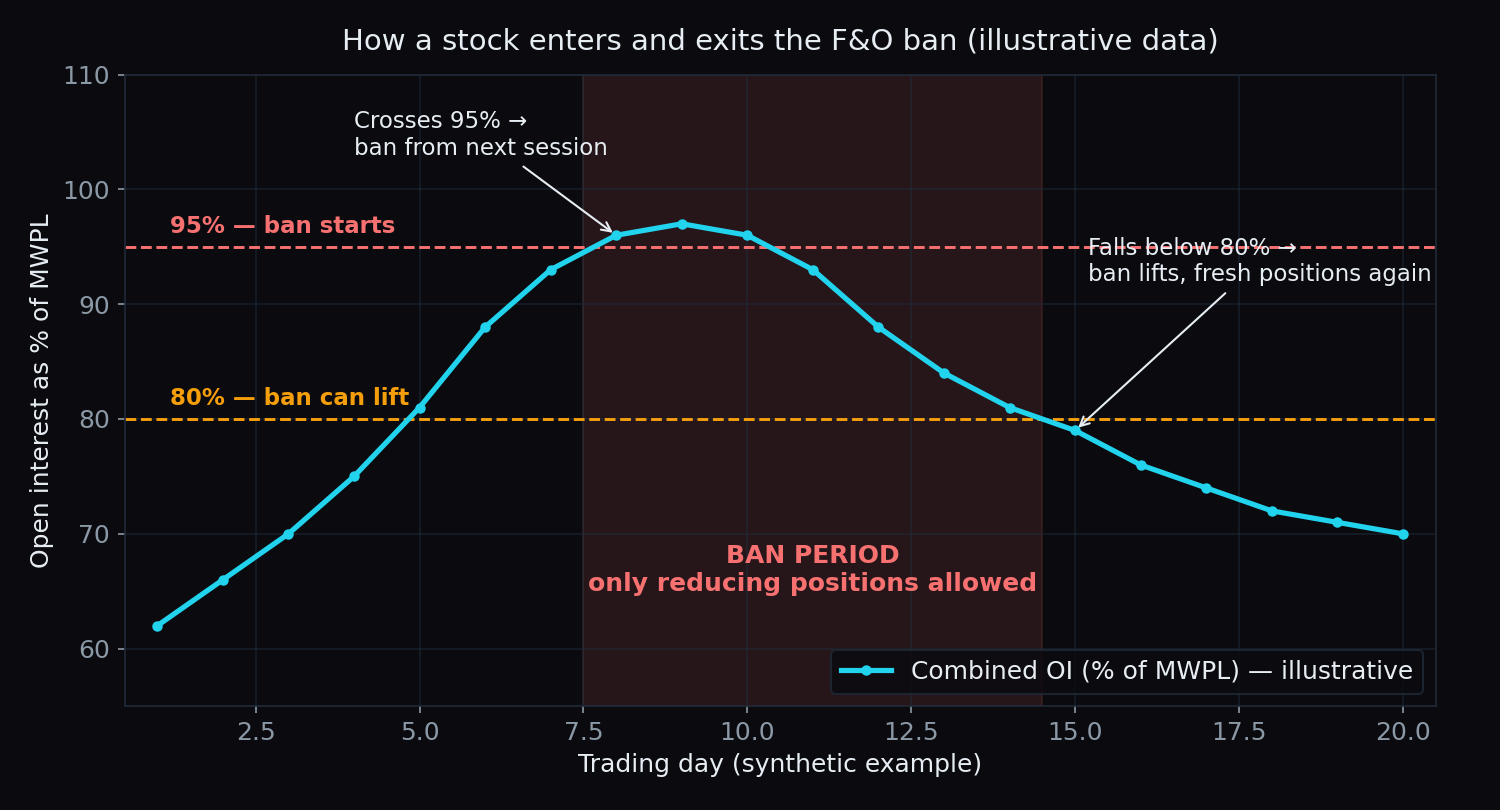
- OI climbs to 19.2 crore → 96% → past the 95% line → the stock enters the F&O ban from the next session.
- During the ban, positions can only be reduced. OI drifts down to 17 crore (85%) → still banned, because the exit level is lower than the entry level.
- OI falls to 15.8 crore → 79% → below 80% → the ban lifts and fresh positions are allowed again.
What you can and cannot do during the ban
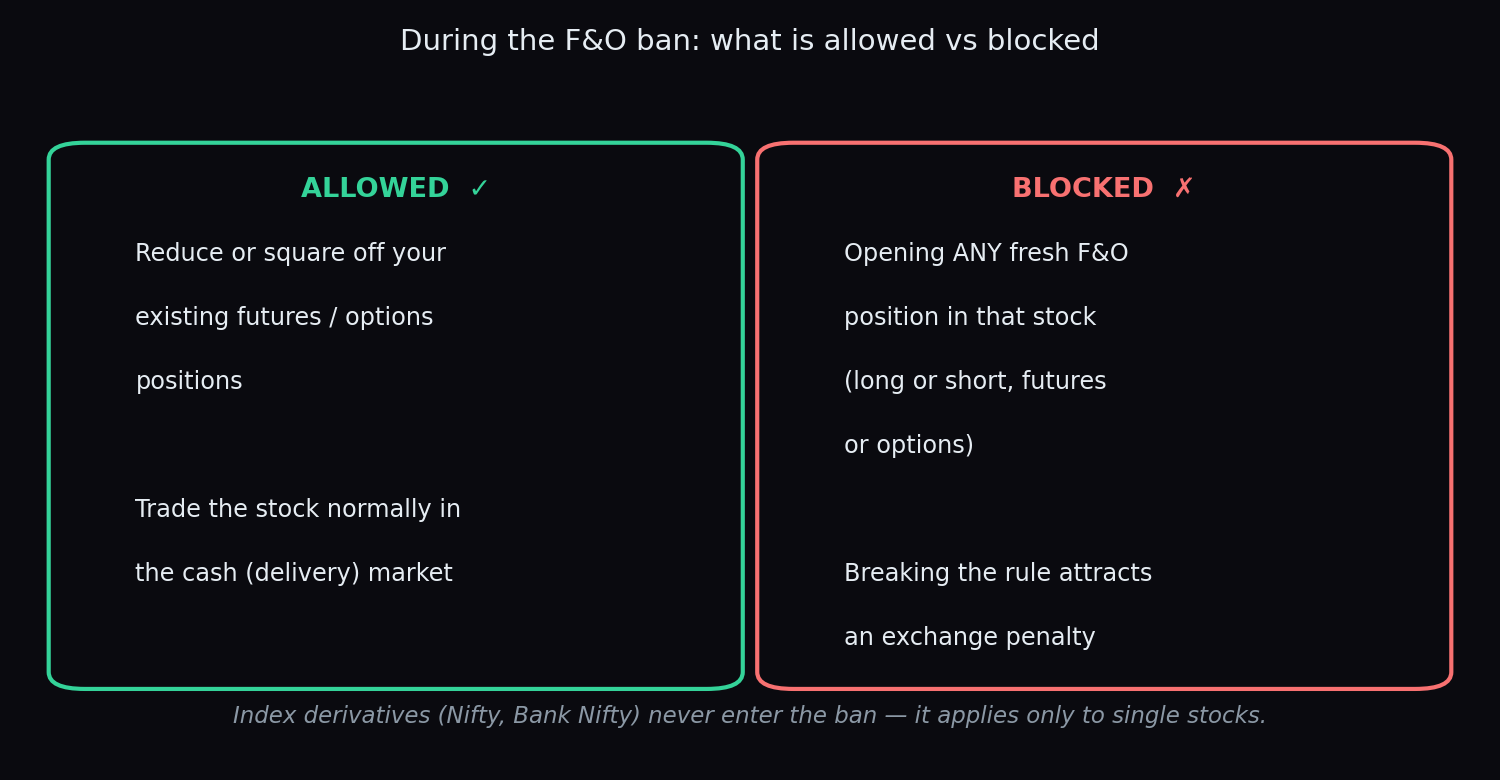
- Allowed: closing or reducing the F&O positions you already hold.
- Allowed: trading the stock normally in the cash (delivery) market — the ban applies only to derivatives.
- Blocked: opening any fresh F&O position, long or short, futures or options. Doing so anyway attracts a penalty from the exchange.
One important carve-out: index derivatives never enter the ban. Nifty and Bank Nifty contracts have no MWPL mechanism — the rule exists for single stocks, where the pool of tradeable shares is limited.
Why the exit is 80%, not 95%
Notice the two different numbers: in at 95%, out below 80%. If the exit were also 95%, a stock hovering near the line would flip in and out of the ban every other day, which would be chaos for everyone holding contracts. The 15-point gap forces a real cool-down — a meaningful amount of open interest has to unwind before the gate reopens. Engineers call this a hysteresis band; your home AC uses the same trick so it doesn't switch on and off every minute.
Why the rule exists at all
A stock with a small free float and a huge pile of derivative positions is easy to push around: a modest amount of money in the cash market can move the price, and that move gets amplified across a much larger stack of contracts. The MWPL cap keeps the size of the derivative market in a stock tethered to the size of the real market in that stock, which protects everyone from manufactured squeezes and disorderly unwinds.
Key takeaway: the F&O ban is not a punishment and not a signal by itself. It is a circuit-breaker on crowding — too many open positions relative to the stock's float — so the exchange stops new entries until the crowd thins out.
The honest catch
Stocks near or inside the ban often see sharp, jumpy moves: when positions can only be unwound, exits get crowded and prices can lurch in either direction. But "often" is not "always", and a ban tells you nothing about direction on its own. Treat the ban list as context — it tells you where positioning is crowded, not what happens next. Anyone claiming the ban list predicts the next move is claiming more than the rule can deliver.
TrueTrend turns market structure like this — positioning, open-interest walls, crowding — into a clear, at-a-glance read across Nifty, Bank Nifty and stock F&O, and it scores its own track record in public. Create a free account to see today's picture.
See these concepts on live market data — free
Create a free TrueTrend account to watch daily support/resistance levels, market regime, and option-positioning charts on NIFTY, BankNifty and 12 more instruments. Every level we publish is scored on a public scoreboard — misses included. No card required.
Free forever tier · daily levels with published hit-rates across every instrument. Descriptive market structure, not investment advice.
Not ready for an account? Get the daily levels by email.
One short email each market day — the indices' call wall, put wall, gamma flip and max pain, and how the last session's levels scored. Free, no account, unsubscribe anytime.
Descriptive market structure, not investment advice. We never share your email.