How Option Sellers' Hedging Moves the Market: Dealer Positioning 101
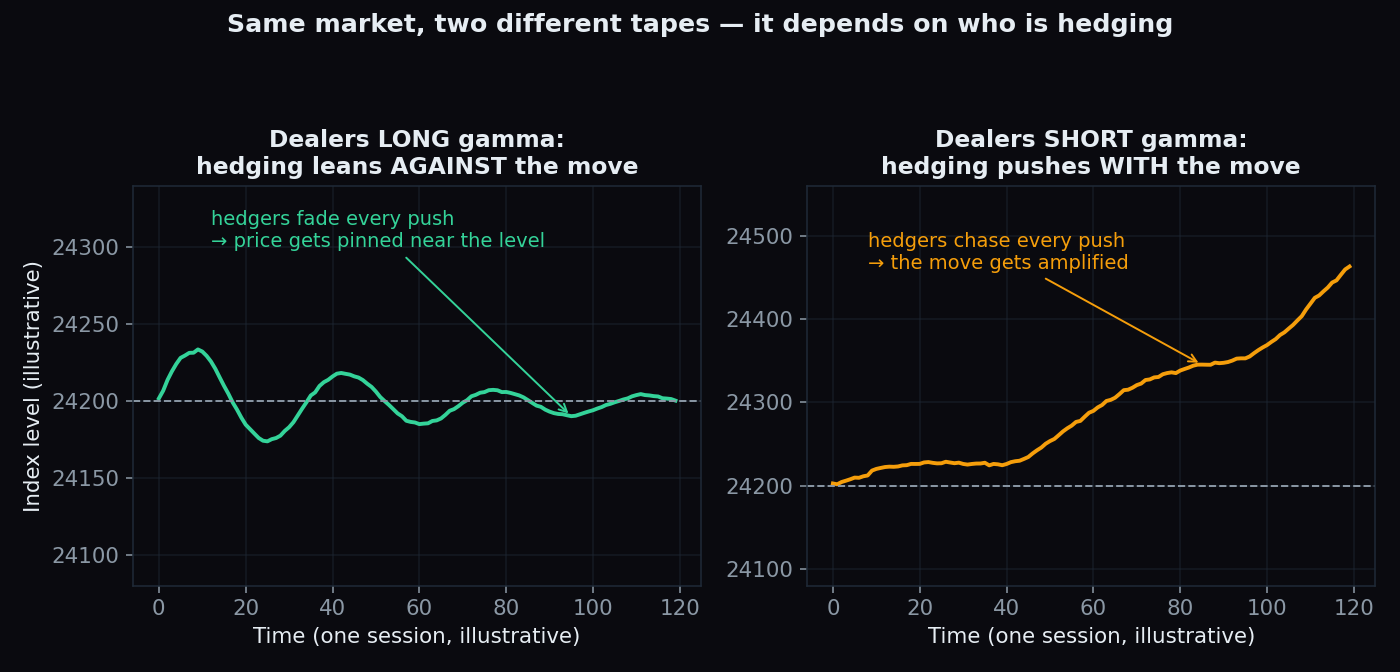
Every option that gets sold creates a side effect most people never see: the seller has to manage the risk of that option, every hour of the trading day. That risk management — called hedging — involves buying and selling the index itself. Done by hundreds of desks at once, it becomes a real force on price. This post explains that force in plain language: who the sellers are, how their hedging works, and why it sometimes glues the market to a level and sometimes shoves it harder in one direction.
First, who actually sells options?
Think of an option seller like an insurance company. An insurance company collects a small premium today and promises to pay out if something bad happens later. An option seller does the same: they collect the option premium, and in return they promise to pay if the index moves past an agreed level, called the strike price. In Indian index options — Nifty and Bank Nifty — the large sellers are typically professional desks: proprietary trading firms, institutions and market makers. In this post we'll call them dealers.
Here is the key: an insurance company doesn't just hope your house won't burn down. It manages its risk deliberately. Dealers do the same thing, minute by minute, using index futures. The sum of what all these hedgers hold — and what they will be forced to do next — is what traders call dealer positioning.
Delta: the dealer's thermostat
Delta measures how much an option's price changes when the index moves by one point. A delta of 0.5 means the option gains about half a point for every one-point rise in the index. (New to the term? Start with our explainer on option delta.)
A dealer who has sold a call option loses money when the index rises. To cancel that risk, the dealer buys index futures — just enough that gains on the futures offset losses on the option. This is called delta hedging. It works like a thermostat: the way a thermostat keeps switching the AC on and off to hold one temperature, the dealer keeps adjusting a futures position to hold their risk at roughly zero.
A worked example with simple numbers
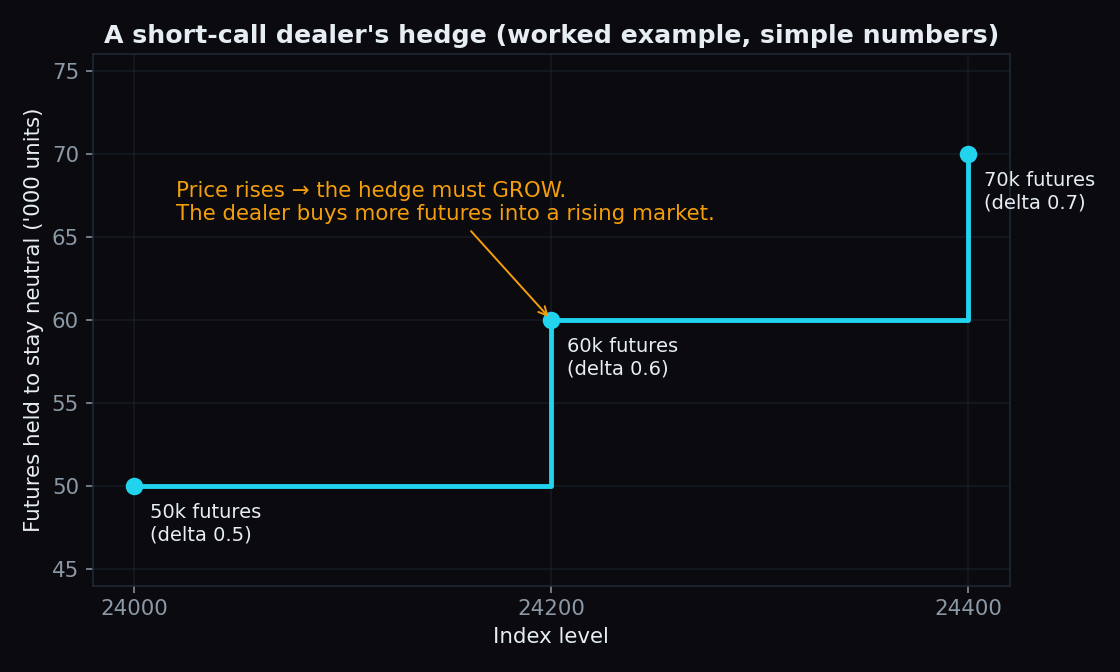
Say a dealer sells call options covering 1,00,000 units of index exposure at a strike of 24,000, and the option's delta is 0.5.
- To be neutral, the dealer holds half of 1,00,000 — that is, 50,000 units of index futures.
- The index rises to 24,200. The option is now more sensitive, and its delta rises to 0.6. The dealer must hold 60,000 units — so they add 10,000 more futures, into a rising market.
- The index rises again to 24,400 and delta becomes 0.7. The dealer adds another 10,000 units, again into strength.
- If the index falls back, the whole process runs in reverse: the dealer trims the hedge, offloading futures into weakness.
Notice the pattern. This dealer is adding exposure as the market rises and cutting it as the market falls — pressing in the same direction as the move. One desk doing this is noise. Hundreds of desks doing it around the same strikes is a flow that shows up on the chart.
Gamma: why the hedge keeps changing
The reason the dealer had to keep adjusting is gamma: the speed at which delta changes as the index moves. When gamma is high, delta changes quickly, so hedges must be adjusted often and in size. Gamma is highest for strikes near the current index level and close to expiry — which is one reason expiry sessions can feel strangely mechanical. (Full explainer: option gamma.)
Long gamma vs short gamma: the market's mood switch
Whether all this hedging calms the market or excites it depends on which side of the options the dealers sit.
- Dealers long gamma (on balance, they own options): their hedge requires trimming exposure into rallies and adding it back on dips. Every push gets faded. Moves shrink, and price tends to get pinned near strikes with heavy open interest.
- Dealers short gamma (on balance, they have sold options): as in our worked example, their hedge requires chasing the move — adding into rallies, cutting into dips. Every push gets amplified, and the tape trends harder and whips faster.
The same news can produce a sleepy, pinned session or a fast trending one. Which of the two you get depends partly on dealer positioning — a force that has nothing to do with the news itself.
The footprint you can see: option walls
Nobody outside a dealing desk can see dealers' actual books. But the NSE option chain publishes open interest — the number of contracts outstanding at each strike — and strikes with unusually heavy open interest are where hedging activity clusters. Traders call the heaviest of these an option wall: a call wall above the market, a put wall below it.
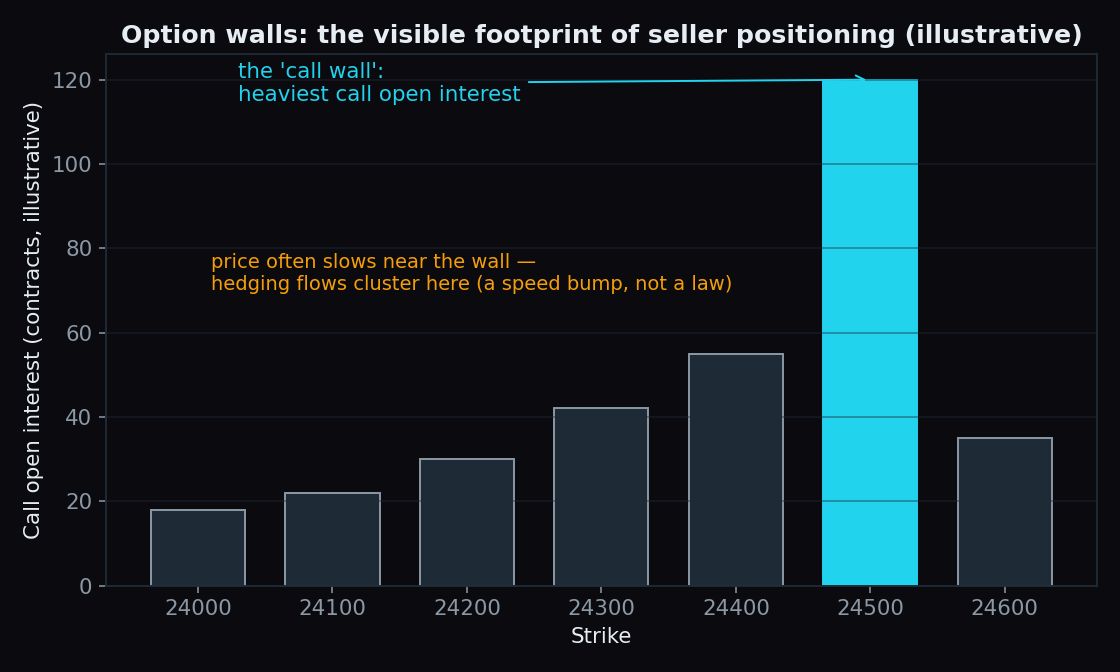
Do these walls actually influence price? We measure this on live data rather than guessing. On the sessions scored so far, Nifty's biggest call wall held 76% of the times price touched it (n=21 touches), and its biggest put wall held 67% of touches (n=30). Bank Nifty is less tidy: its put wall held 62% of touches (n=16) while its call wall held only 40% (n=10). And the popular idea that expiry price gets pulled to "max pain" is weaker still — Nifty closed within one strike of max pain in just 40% of scored sessions (n=87). The numbers update daily on the public scoreboard, and we've written up the full results in do option walls hold? and does price gravitate to max pain?
The honest reading: walls behave like speed bumps, not brick walls. Price often slows or stalls near them because hedging flows concentrate there — but a decent fraction of the time it drives straight through.
The honest catch
Three limits worth stating plainly. First, dealer positioning is an inference, not an observation — open interest tells you how many contracts exist, not who is long or short them, so every positioning framework rests on assumptions that can be wrong. Second, the hit-rates above come from limited samples and move as new sessions are scored; a 76% hold rate still fails roughly one touch in four. Third, hedging is one force among many — a genuine news shock runs straight through a wall without slowing down. Treat this lens as a way to understand why the tape behaves the way it does, not as a prediction machine.
Reading hedging pressure from a raw option chain takes real practice. TrueTrend turns this market structure — walls, positioning shifts and market regime — into a clear, at-a-glance read across Nifty, Bank Nifty and F&O stocks, and it scores its own hit-rates in public. Create a free account to see today's picture.
See these concepts on live market data — free
Create a free TrueTrend account to watch daily support/resistance levels, market regime, and option-positioning charts on NIFTY, BankNifty and 12 more instruments. Every level we publish is scored on a public scoreboard — misses included. No card required.
Free forever tier · daily levels with published hit-rates across every instrument. Descriptive market structure, not investment advice.
Not ready for an account? Get the daily levels by email.
One short email each market day — the indices' call wall, put wall, gamma flip and max pain, and how the last session's levels scored. Free, no account, unsubscribe anytime.
Descriptive market structure, not investment advice. We never share your email.