Ichimoku Cloud Explained: The 5 Lines and What They Mean
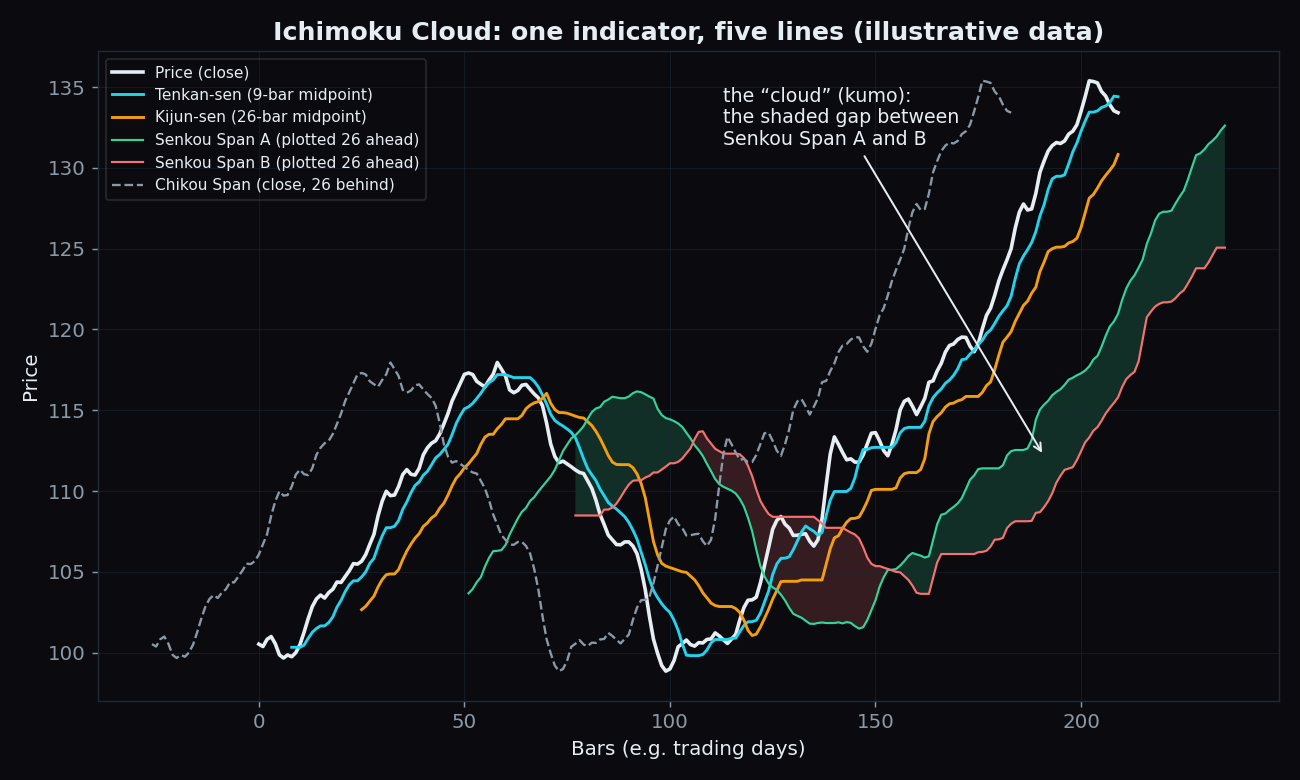
Switch on the Ichimoku indicator and your clean price chart suddenly grows five extra lines and a shaded blob. It looks like the most complicated overlay in the toolbox. It is actually one repeated idea — the midpoint of a recent price range — drawn at different speeds and shifted in time. The name says so: Ichimoku Kinko Hyo is Japanese for roughly "one-glance equilibrium chart". Once you know what each line is, the whole thing reads in a glance.
Where it comes from
The system was developed by Goichi Hosoda, a Japanese financial journalist, who refined it for decades before publishing it in 1969. His goal was a single picture that answers three questions at once: which way is the trend pointing, how strong is it, and where might price meet support or resistance next. Everything below is built from ordinary highs, lows and closes — no volumes, no external data.
One building block: the range midpoint
Almost every Ichimoku line is a midpoint: take the highest high and the lowest low over some window, and mark the level halfway between them. Note that this is not the same as a moving average. An average of closes reflects where price spent most of its time; a midpoint only cares about the extremes of the range. One sharp spike can move a midpoint a lot while barely denting an average.
The five lines
- Tenkan-sen (conversion line) — midpoint of the last 9 bars. The fast line; it hugs price.
- Kijun-sen (base line) — midpoint of the last 26 bars. The slow line; it moves more deliberately and is often watched as a trend reference.
- Senkou Span A (leading span A) — the average of Tenkan and Kijun, but drawn 26 bars into the future.
- Senkou Span B (leading span B) — midpoint of the last 52 bars, also drawn 26 bars into the future.
- Chikou span (lagging span) — today's close, drawn 26 bars into the past, so you can compare it against where price was a month ago.
An everyday way to hold all five: think of a fitness tracker on a long run. Tenkan is your pace over the last minute, Kijun is your pace over the whole run, and the cloud is a shaded band showing the range your pace has lived in — drawn a little way ahead on the track so you can see it coming. Chikou is you glancing back to check whether you are ahead of where you were a lap ago.
The famous cloud (kumo) is simply the shaded area between Senkou Span A and Senkou Span B. When A is above B the cloud is usually coloured green (the faster inputs are above the slower ones — an uptrend flavour); when A is below B it is coloured red.
Why 9, 26 and 52? They come from Hosoda's era, when Japanese markets traded six days a week: 26 was roughly one month of sessions and 52 roughly two. Most platforms keep these defaults today even though the calendar has changed.
A worked example with round numbers
Say Nifty's last 9 sessions ranged between a high of 22,600 and a low of 22,400, the last 26 sessions between 22,700 and 22,100, and the last 52 sessions between 22,800 and 21,800. Then:
- Tenkan = (22,600 + 22,400) ÷ 2 = 22,500
- Kijun = (22,700 + 22,100) ÷ 2 = 22,400
- Senkou A = (22,500 + 22,400) ÷ 2 = 22,450, drawn 26 sessions ahead
- Senkou B = (22,800 + 21,800) ÷ 2 = 22,300, drawn 26 sessions ahead
Senkou A (22,450) sits above Senkou B (22,300), so the cloud a month ahead on the chart is a green band 150 points thick. The fifth line, Chikou, is just today's close stamped 26 sessions back. That's the entire machine — four midpoint-style calculations and a time shift.
The time shift is the unusual part
Most indicators sit directly on top of today's bar. Ichimoku deliberately slides two of its pieces along the time axis. The two Senkou spans are pushed 26 bars forward, so the chart always shows a cloud hovering ahead of the latest price — a pre-drawn map of where support or resistance may sit, calculated purely from past prices. The Chikou span is pulled 26 bars back, letting you eyeball today's close against the price action of a month ago without counting candles.
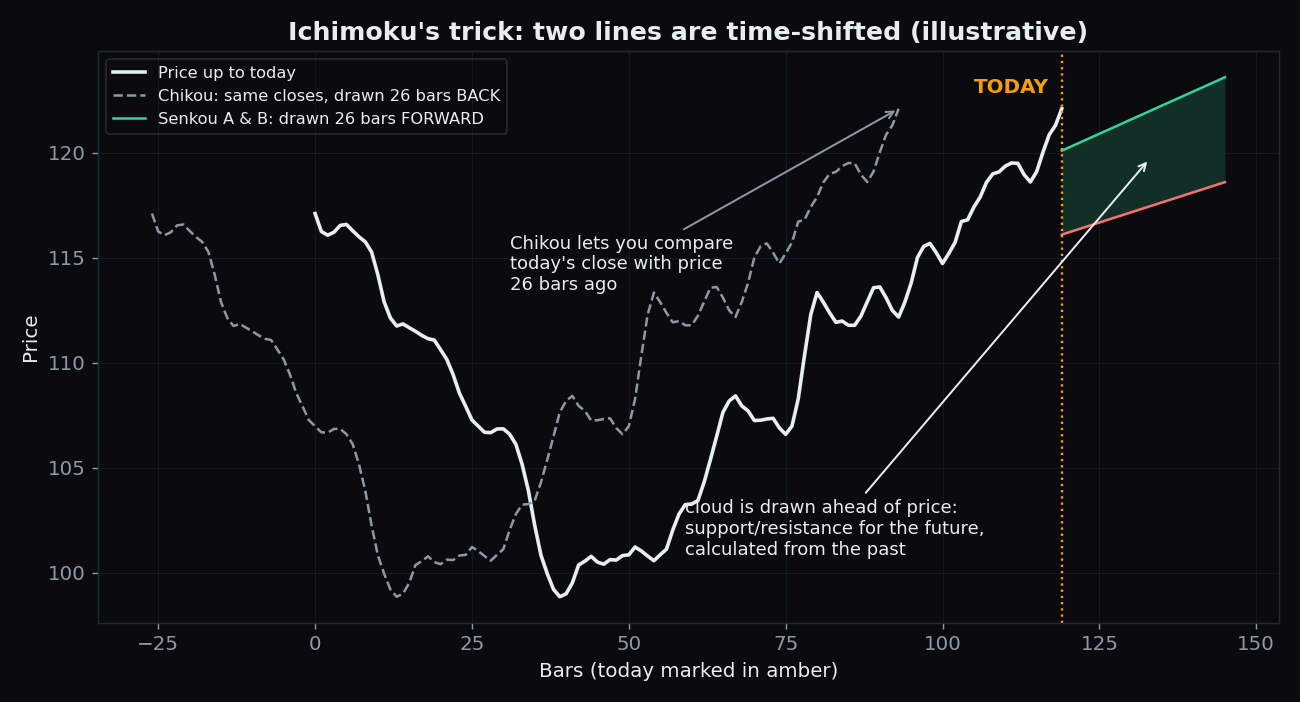
The cloud ahead of price is not a forecast. It is yesterday's arithmetic drawn at tomorrow's position. It marks zones traders will watch — it does not know what price will do when it gets there.
How traders read it
All of these are descriptive conventions, not signals to act on:
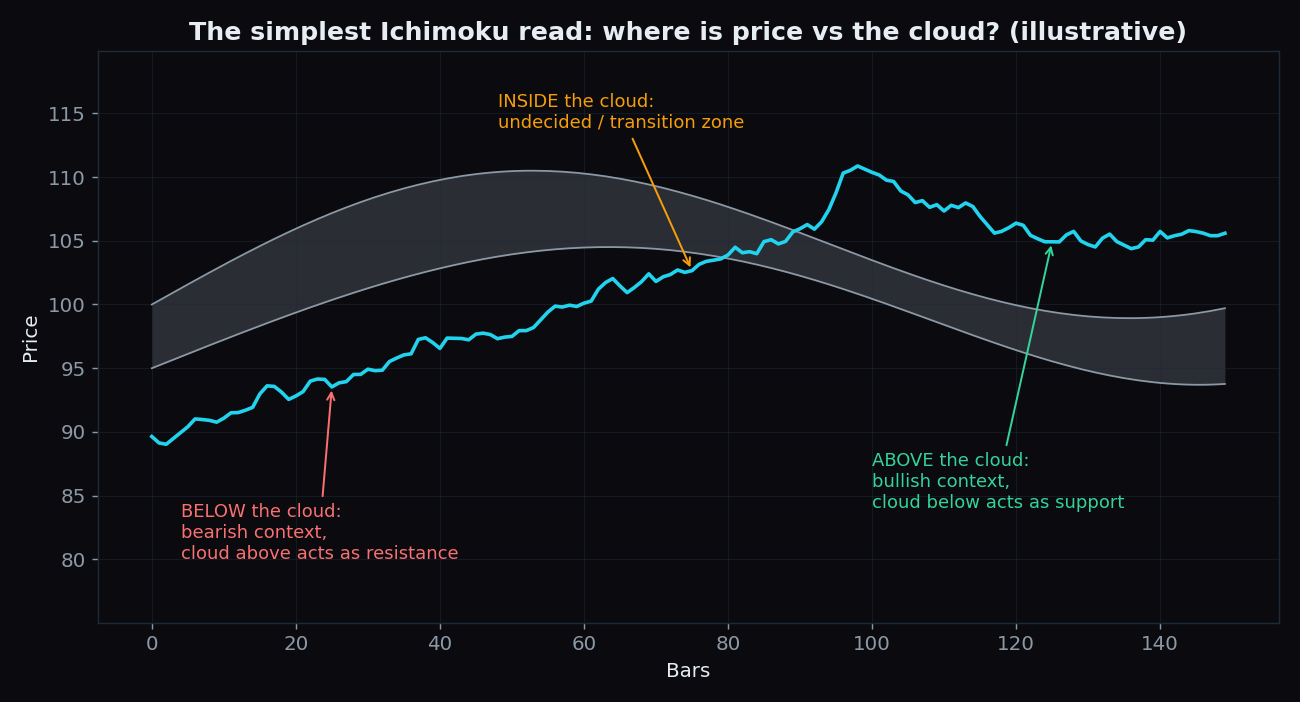
- Price vs the cloud. The one-glance read: price above the cloud is treated as bullish context, below as bearish context, and inside the cloud as undecided. The cloud itself is watched as a support and resistance zone rather than a single line.
- Cloud thickness. A thick cloud means the 26- and 52-bar ranges disagree a lot — a wide zone that price may struggle to cross. A thin cloud is a weak barrier.
- Tenkan–Kijun crosses. The fast line crossing the slow one is read much like a moving-average crossover — and it shares the same weakness: it fires late and often in choppy markets.
- Chikou clearance. Some traders want the Chikou span clear of the old price bars before trusting a trend read — effectively asking "is today's close beyond where price was a month ago?"
The honest catch
- Everything is backward-looking. Midpoints of past ranges, shifted around. The cloud "ahead" contains zero new information about the future.
- Sideways markets shred it. When there is no trend, price weaves through the cloud, the lines braid together, and the crosses whipsaw — the same failure mode as every trend-following tool.
- Five lines can disagree. Price above the cloud while Tenkan crosses down and Chikou sits inside old candles is a normal, murky state. The "one glance" is often ambiguous mid-trend.
- The settings are historical. 9/26/52 encode a six-day Japanese trading week from the 1960s. They are conventions, not optimised truths — and anyone quoting a precise win-rate for cloud signals should also show the sample size behind it.
Used with those limits in mind, Ichimoku is best treated as a compact dashboard of trend context — one picture that summarises where price sits relative to its recent ranges, at two speeds, with the levels pre-drawn.
TrueTrend does the one-glance job for Indian markets — live positioning and market structure across Nifty, Bank Nifty and F&O, condensed into a clear read, with its own track record scored in public. Create a free account to see today's picture.
See these concepts on live market data — free
Create a free TrueTrend account to watch daily support/resistance levels, market regime, and option-positioning charts on NIFTY, BankNifty and 12 more instruments. Every level we publish is scored on a public scoreboard — misses included. No card required.
Free forever tier · daily levels with published hit-rates across every instrument. Descriptive market structure, not investment advice.
Not ready for an account? Get the daily levels by email.
One short email each market day — the indices' call wall, put wall, gamma flip and max pain, and how the last session's levels scored. Free, no account, unsubscribe anytime.
Descriptive market structure, not investment advice. We never share your email.