The Four OI Quadrants: Long Buildup to Short Covering
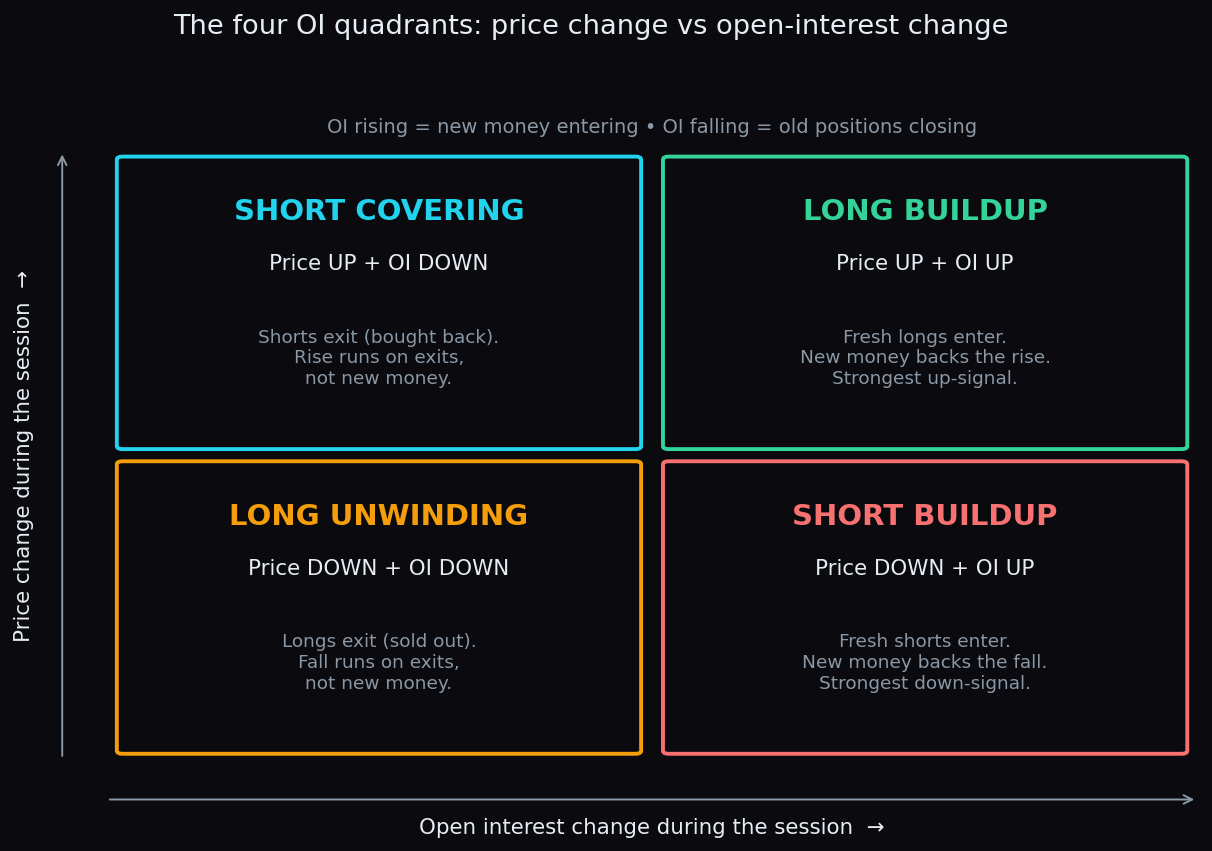
Open interest tells you whether money is entering or leaving a market. Price tells you which side is winning. Read the two together and every move sorts into one of four boxes — long buildup, short buildup, short covering, long unwinding. This post explains each box in plain language, then shows how a single option strike can migrate through several boxes in one trading session.
First, what open interest actually counts
Open interest (OI) is the number of derivative contracts currently open. Every contract has two sides: one trader who is long (gains if price rises) and one who is short (gains if price falls). One open contract equals one long plus one short, counted once.
OI only changes when contracts are created or closed:
- OI rises when a brand-new long meets a brand-new short. Fresh money entered.
- OI falls when an existing long and an existing short both exit against each other. Money left.
- OI is flat when a position simply changes hands from one trader to another.
If OI is new to you, start with open interest vs volume and change in OI vs total OI — this post builds directly on those two ideas.
The 2×2 grid: price change and OI change
Two inputs, two directions each, four combinations. That is the whole framework:
1. Long buildup: price up + OI up
Price is rising and fresh contracts are being opened. New longs are pressing in, committing new money as price climbs. Of the two up-move quadrants, this is the one with fuel behind it.
2. Short buildup: price down + OI up
Price is falling while fresh contracts open. New shorts are pressing in with new money. It is the mirror image of long buildup: a down-move with conviction behind it.
3. Short covering: price up + OI down
Price is rising while contracts are being closed. Existing shorts are exiting — each short is closed by getting the contract bought back, which pushes price up. The move can be sharp, but it runs on exits, not on new money. Once the last uncomfortable short has covered, the fuel is gone.
4. Long unwinding: price down + OI down
Price is falling while contracts close. Existing longs are exiting — their contracts get sold out into the market, which presses price down. Again: an exit-driven move, not a conviction-driven one.
One-line memory hook: OI up means new money agrees with the move. OI down means the move is old positions leaving.
An analogy: the tug-of-war headcount
Picture a tug-of-war. The rope's position is the price. OI is the number of people actually pulling.
- The rope moves right while more people join both ends: a real contest with growing stakes. That is a buildup.
- The rope moves right because people on the left side let go and walk away: the rope still moved, but through surrender, not strength. That is covering or unwinding.
Both look identical if you only watch the rope. You need the headcount — the OI — to know which kind of move it was.
A worked example with round numbers
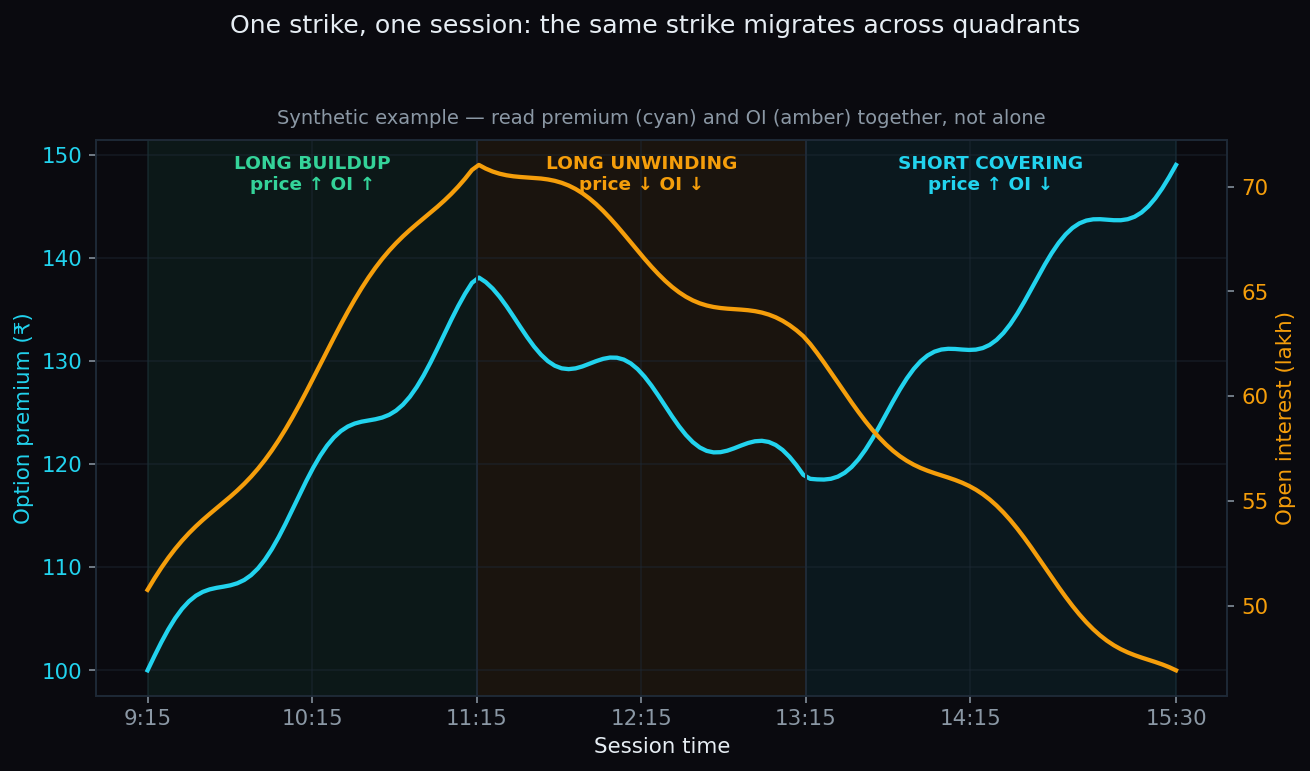
Take a Nifty 25,000 call option and four snapshots of its premium (the option's price) and its OI:
- 9:20 — premium ₹100, OI 50 lakh contracts.
- 11:15 — premium ₹140, OI 70 lakh. Premium up ₹40, OI up 20 lakh: long buildup. Fresh longs entered as the premium rose.
- 13:15 — premium ₹120, OI 63 lakh. Premium down, OI down 7 lakh: long unwinding. Part of the morning crowd booked out.
- 15:15 — premium ₹145, OI 56 lakh. Premium up, OI down again: short covering. Writers who were short this call exited into the late move.
Same strike, one session, three different labels. That is normal — and it is the point of the next section.
How strikes migrate between quadrants through a session
Quadrant labels are not identities; they are weather readings. A strike is not “a long-buildup strike” for the day — it is in long buildup right now, over whatever window you measured. Typical intraday arcs look like this:
- Morning conviction, afternoon exit. Long buildup from the open, then long unwinding after lunch as early entrants book gains. Price gives back part of the move on falling OI.
- Failed down-move. Short buildup in the first hour, then the level holds and the same shorts cover through the afternoon — the down quadrant flips to short covering without any fresh longs appearing.
- Expiry-day churn. Near expiry, strikes hop between quadrants quickly as option writers open and close positions around every small move; labels measured over 15-minute windows can flip several times an hour.
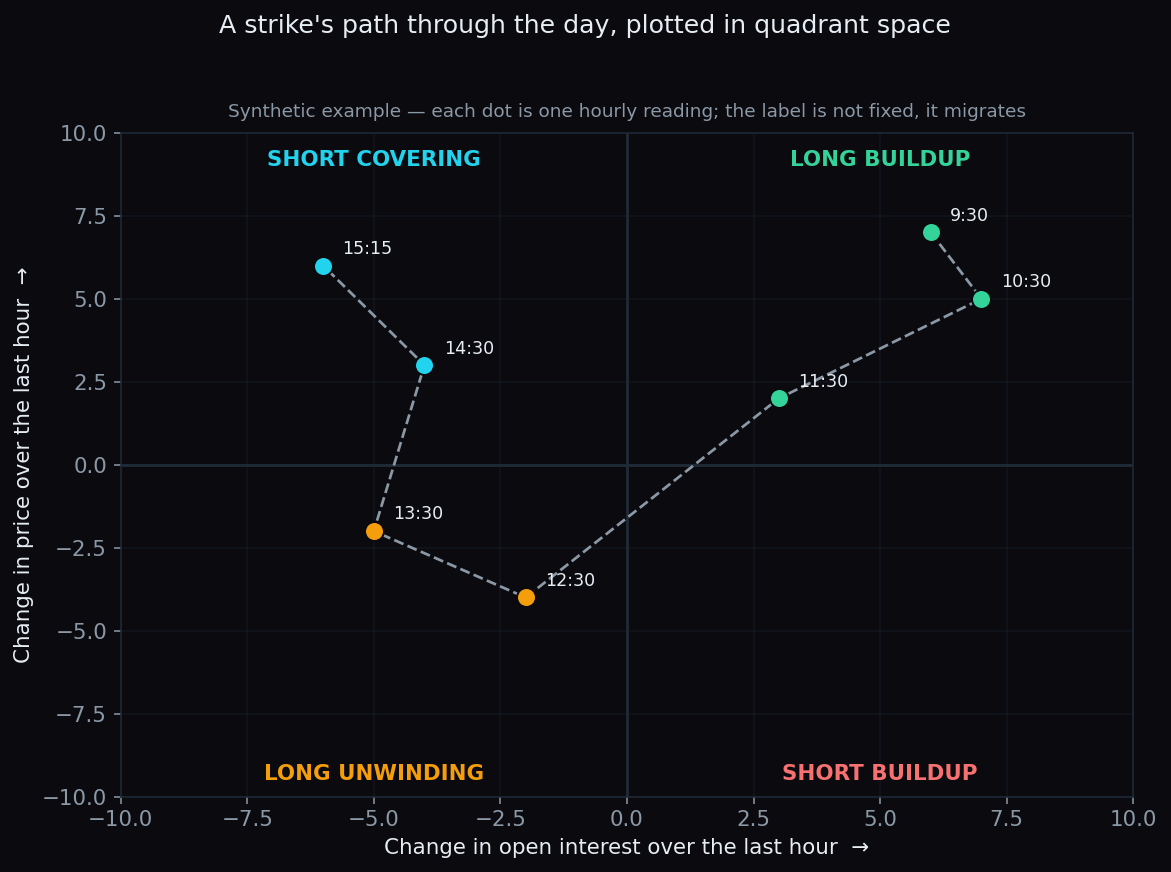
The chart above plots hourly readings of one strike as a dot in “quadrant space”: OI change across, price change up. The dot's drift through the day is the migration. The path tells you more than any single reading: a buildup that quietly turns into unwinding is a very different session from a buildup that keeps adding.
Futures vs option strikes: the same grid, read differently
The quadrant labels were born in the futures market, where “price” simply means the futures price. On an option chain, apply the same grid per strike using the premium and that strike's OI. One honest nuance: every new contract needs both a long and a short, so rising OI never literally means “only longs entered”. The price direction is what reveals who was pressing: rising premium with rising OI means the longs were the aggressive side and writers supplied contracts at ever-higher prices — hence “long buildup”.
Also remember that moneyness colours the reading: heavy OI building at an out-of-the-money strike often reflects writers treating it as a level they expect to hold, which is why analysts read big OI concentrations as “walls”.
The honest catch
Quadrants describe what just happened. They do not forecast what happens next. Keep four caveats in mind:
- OI data lags. Public option-chain pages refresh OI periodically, not tick by tick. Your quadrant label is already minutes old the moment you compute it.
- Noise near zero. When the price or OI change is tiny, the label flips randomly. A quadrant reading on a 0.05% move means nothing.
- Not every contract is conviction. OI also rises from hedges, spreads and arbitrage positions, which say little about direction.
- Exit-driven moves end without warning. Short-covering rallies and long-unwinding dips often stop the moment the exits are done.
This is also why positioning claims should be scored in public, not just asserted. For example, across the last 20 times Nifty touched its biggest call-side OI wall, the wall held 75% of the time (n=20 touches), while the put-side wall held 62% (n=32 touches) — measured live on a public scoreboard. Useful odds; clearly not certainty.
Tracking four quadrants across dozens of strikes, every few minutes, is a lot of manual work. TrueTrend turns live Nifty, Bank Nifty and F&O positioning into a clear, at-a-glance read — and scores its own record in public. Create a free account to see today's picture.
See these concepts on live market data — free
Create a free TrueTrend account to watch daily support/resistance levels, market regime, and option-positioning charts on NIFTY, BankNifty and 12 more instruments. Every level we publish is scored on a public scoreboard — misses included. No card required.
Free forever tier · daily levels with published hit-rates across every instrument. Descriptive market structure, not investment advice.
Not ready for an account? Get the daily levels by email.
One short email each market day — the indices' call wall, put wall, gamma flip and max pain, and how the last session's levels scored. Free, no account, unsubscribe anytime.
Descriptive market structure, not investment advice. We never share your email.