Operating Margin vs Net Margin: Where a Company's Profit Leaks
Take two companies that each ring up ₹100 crore of sales a year and run their factories equally well. At the end of the year, one keeps ₹14 crore as profit and the other keeps only ₹5 crore. Nothing is wrong with the second company's products. The difference sits in two numbers most people skim past in a results announcement: operating margin and net margin. Read them together and you can see exactly where a company's profit leaks away.
First, what exactly is a margin?
A margin is profit written as a percentage of sales. If a company earns ₹100 of revenue and keeps ₹10 of it as profit, its margin is 10%. Margins are useful because they let you compare a giant company with a tiny one — both are measured per ₹100 of sales.
Here is a simple picture to hold in your head. Imagine revenue as water poured into the top of a long pipe, with a bucket at the bottom. Every cost is a small hole in the pipe. Profit is whatever water actually reaches the bucket. The two margins tell you how much water survives at two different points in the pipe.
The two margins, in plain words
- Operating margin = operating profit divided by revenue. Operating profit is what is left after the costs of actually running the business: raw materials, factory wages, salaries, rent, electricity, advertising. It measures how good the core business is. (In results statements it is often close to the line called EBIT — earnings before interest and tax.)
- Net margin = net profit divided by revenue. Net profit is the final “bottom line” after everything else has also been paid: interest on loans, tax, and any one-off gains or losses.
Operating margin answers “how well does this business run?” Net margin answers “how much of each rupee of sales actually survives for shareholders?” The gap between the two is the leak.
A worked example: the ₹100 crore biscuit company
Say a biscuit maker reports the following for one year:
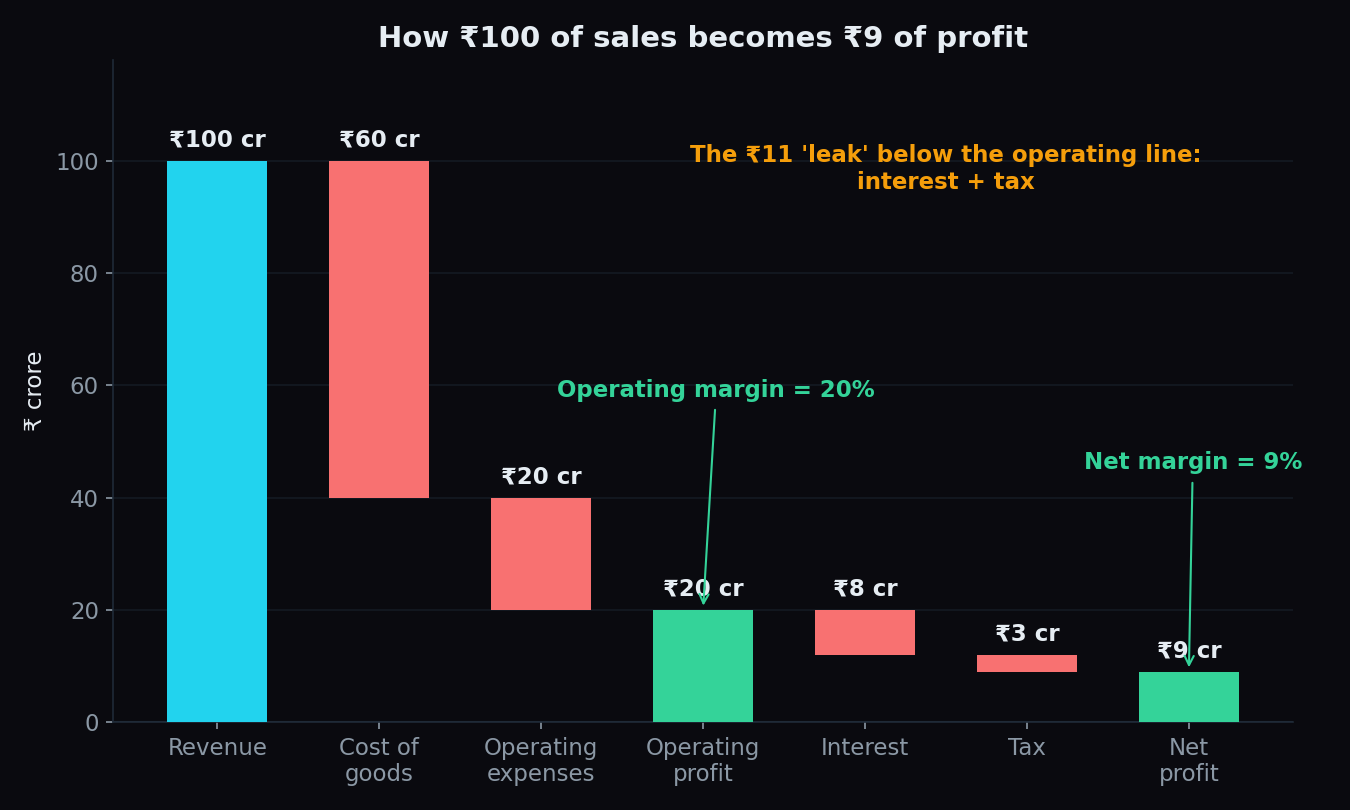
- Revenue: ₹100 crore.
- Cost of making the biscuits (flour, sugar, packaging, factory wages): ₹60 crore.
- Other running costs (office salaries, rent, advertising): ₹20 crore.
- Operating profit: ₹20 crore — an operating margin of 20%.
- Interest on loans: ₹8 crore.
- Tax: ₹3 crore.
- Net profit: ₹9 crore — a net margin of 9%.
The business itself earns 20 paise on every rupee of sales — a perfectly healthy machine. But by the time the money reaches the bottom line, 11 of those 20 paise have leaked away: 8 to lenders as interest and 3 to the taxman. Shareholders are left with 9 paise per rupee of sales.
Where the leak happens
Everything below the operating-profit line in the profit-and-loss statement (the P&L) is the leak zone. The usual holes are:
- Interest. The more debt a company carries, the bigger this hole. Two companies with identical factories can have very different bottom lines purely because one borrowed heavily. This hole is invisible if you only look at operating margin.
- Tax. This hole is broadly similar across most companies — for most large Indian firms it takes roughly a quarter of pre-tax profit — so it rarely explains a big difference between two companies.
- One-off items. A gain from the sale of a factory, a penalty, a write-off of a failed project. These can make a single year's net profit jump or crash without saying anything about the business.
- Other income. Interest earned on a cash pile, or rent from a spare building. This works in reverse — it can quietly plug the leak and make net margin look better than the core business deserves.
Same business, very different bottom line
Here are two imaginary companies with identical operations. Both convert 20% of revenue into operating profit. Company A carries little debt; Company B borrowed heavily to build its plants.
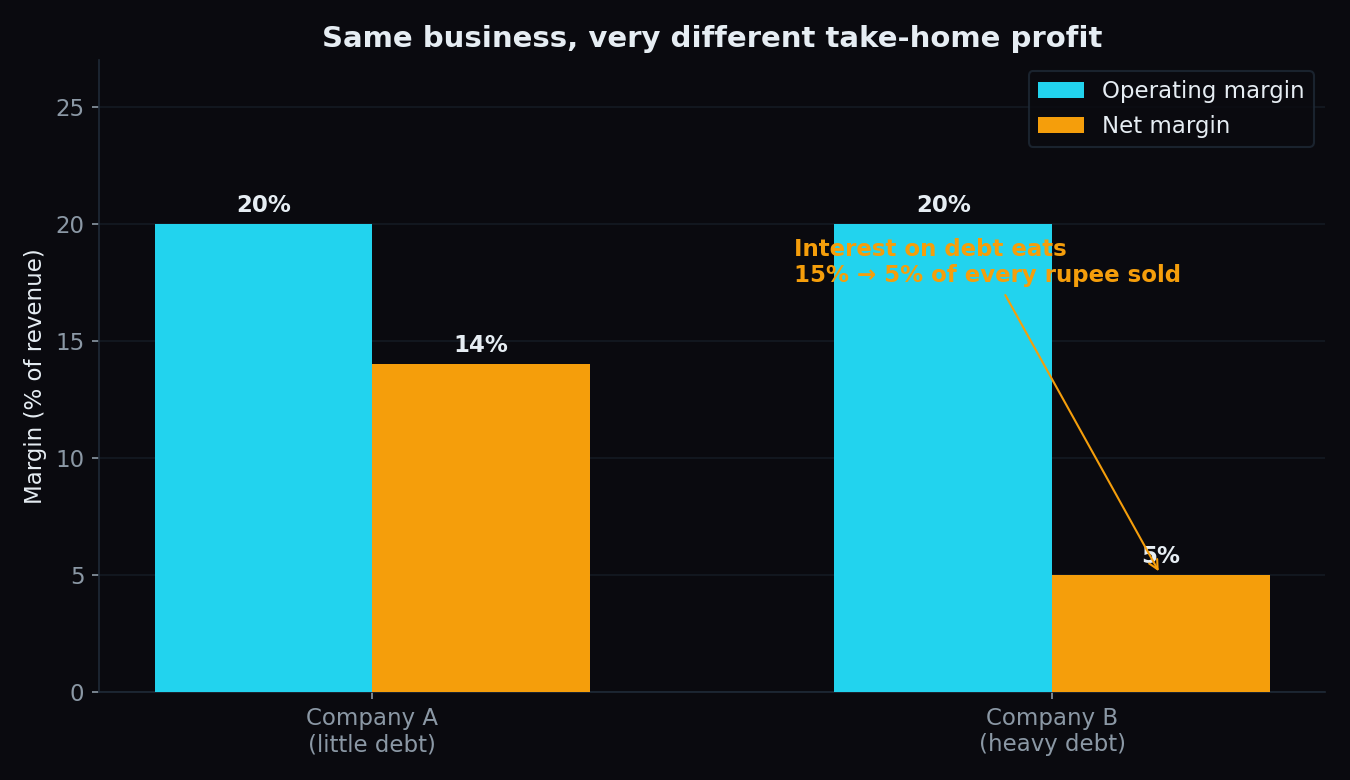
On operating margin they look like twins. On net margin, Company A keeps 14 paise per rupee of revenue while Company B keeps just 5, because interest payments swallow the difference. If you only glanced at one number, you could reach opposite conclusions about the same pair of companies.
Watch the gap over time
A single year is a snapshot. The more useful habit is watching how the gap between the two margins behaves across years.
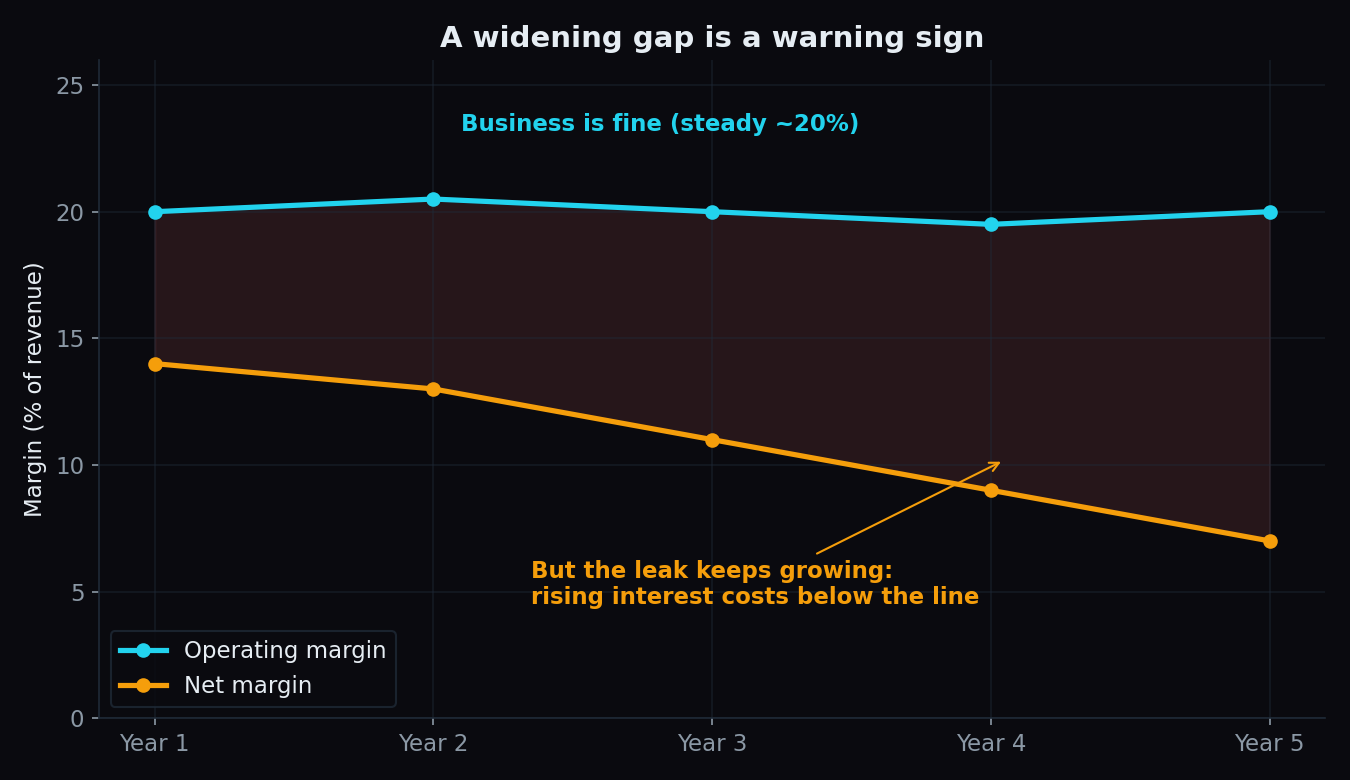
In this illustration the operating margin holds steady near 20% for five years — the core business is fine. But the net margin slides from 14% to 7%. The leak is growing, and since tax rates rarely move much, the usual suspect is rising interest costs from growing debt. A widening gap like this often shows up in the P&L years before trouble makes headlines.
Reading the two margins together
The pair forms a simple two-question checklist when you open a results statement:
- Both high and steady: the business earns well and keeps most of it.
- High operating, much lower net: a good business with a leaky pipe — the notes to the accounts usually reveal whether the hole is interest, tax or a one-off.
- Modest operating, surprisingly high net: look for one-off gains or large other income propping up the bottom line.
- Both low: either a thin-margin industry or a struggling company — comparing with rivals in the same industry tells you which.
These margins are one piece of a larger toolkit. They pair naturally with earnings per share, which divides that same net profit across shares, and with the balance sheet, which shows the debt responsible for the interest hole. If you are new to all of this, start with our primer on fundamental analysis.
The honest catch
- Margins only compare within an industry. A grocery retailer may run on low single-digit net margins and still be excellent; an IT services company may run far higher. Comparing across industries is meaningless.
- One quarter is noise. Festive-season sales, a raw-material spike or a one-off item can swing a single quarter. Trends over several years matter more.
- Labels vary. Many Indian companies headline “EBITDA margin”, which ignores depreciation as well — it is not the same as operating margin, so check which line a number refers to before comparing.
- Net margin can lie in both directions. A one-time tax credit or asset-sale gain can inflate it; a one-time write-off can crush it. The operating line is usually the more honest read on the business itself.
Key takeaway: operating margin tells you how good the business is; net margin tells you how much of that goodness survives interest and tax. When the two drift apart — or the gap widens year after year — the P&L is showing you exactly where the profit leaks.
Margins describe a company's long-term health. Day to day, index prices also move with positioning in futures and options — a different kind of leak to watch. TrueTrend turns that market structure into a clear, at-a-glance read across Nifty, Bank Nifty and F&O, and scores its own track record in public. Create a free account to see it.
See these concepts on live market data — free
Create a free TrueTrend account to watch daily support/resistance levels, market regime, and option-positioning charts on NIFTY, BankNifty and 12 more instruments. Every level we publish is scored on a public scoreboard — misses included. No card required.
Free forever tier · daily levels with published hit-rates across every instrument. Descriptive market structure, not investment advice.
Not ready for an account? Get the daily levels by email.
One short email each market day — the indices' call wall, put wall, gamma flip and max pain, and how the last session's levels scored. Free, no account, unsubscribe anytime.
Descriptive market structure, not investment advice. We never share your email.