India VIX: What It Actually Tells You (and What It Doesn't)
The India VIX gets treated like a crystal ball. When it jumps, headlines shout “fear is back”; when it sinks, everyone relaxes. But a single number can only say so much — and most of the mistakes people make with the VIX come from asking it questions it was never built to answer. This post is the honest version: what the fear index genuinely tells you, and the four big things it does not.
If you have never met the VIX before, start with our plain-English primer, India VIX explained: the market’s fear index, then come back here for the myth-busting.
The one thing it actually tells you
The India VIX is a single number, published by the exchange, that estimates how much the Nifty is expected to swing over roughly the next 30 days. It is quoted as an annualised percentage, and it is calculated from the prices of Nifty options — contracts people buy to protect against, or bet on, market moves. When the crowd gets nervous, it pays up for that protection, option prices rise, and the VIX reads those richer prices as “bigger swings expected.” That forward-looking guess is called implied volatility.
So the honest, one-line summary is this: the VIX tells you the expected size of the swing — and nothing more. A reading of 14 says “the market expects a calm month.” A reading of 30 says “the market expects a bumpy one.” That is genuinely useful. It is also where its job ends.
What it does NOT tell you #1: direction
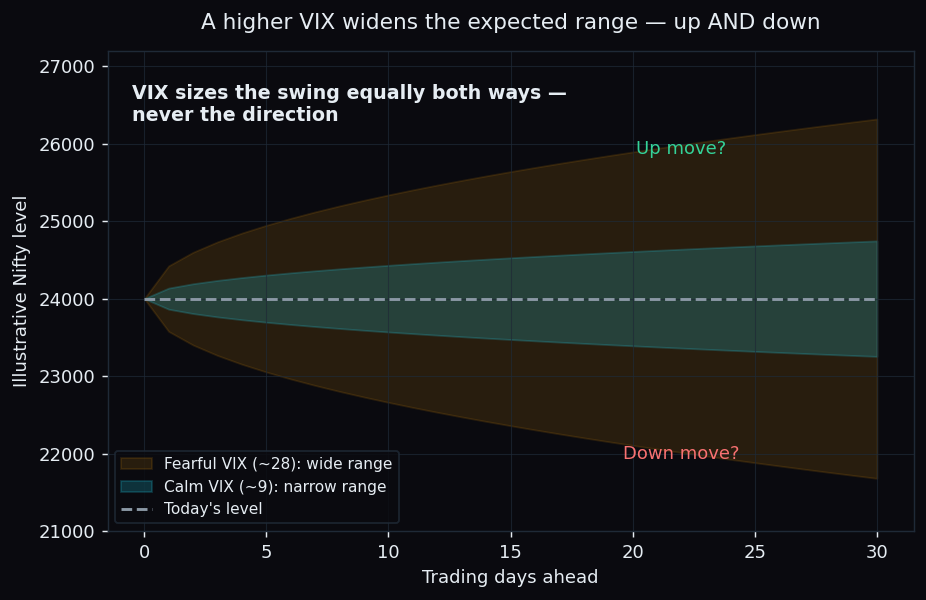
This is the biggest myth. A high VIX does not mean the market is about to fall, and a low VIX does not mean it will rise. The VIX widens the expected range symmetrically — equally up and down — as the chart above shows. It is direction-blind by design.
Here is the everyday analogy. The VIX is like a weather forecast that says “expect strong winds this week.” Strong winds can blow your kite higher or knock it down; the forecast only tells you the strength, not which way. People confuse a high VIX with a coming crash only because fear and falling markets often show up together — but the fear reading itself never points a direction.
What it does NOT tell you #2: the real size of a daily move
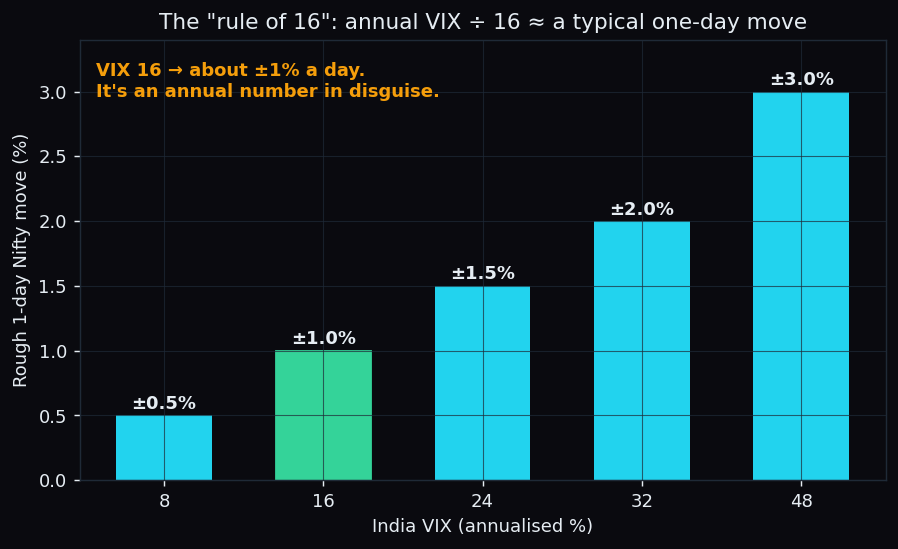
A VIX of 16 sounds alarming until you remember it is an annualised figure. To get a rough one-day move, traders use the “rule of 16”: divide the VIX by about 16 (which is close to the square root of the ~252 trading days in a year).
Worked example with round numbers: a VIX of 16 implies a typical daily Nifty move of about ±1% — roughly ±240 points on a 24,000 Nifty. A VIX of 32 doubles that to about ±2%. Read the raw number without converting it and you will badly over-estimate the day-to-day drama.
What it does NOT tell you #3: which stock (or when)
The India VIX is built only from Nifty index options. It is a market-wide mood reading, not a stock-level one. A single company can crater on bad results on a perfectly calm-VIX day, and a stock you own can rip higher while the index sits still. The fear index says nothing about any individual name.
It is also silent on timing. A VIX of 12 can stay at 12 for weeks, then leap overnight; a VIX of 28 can drift for a month without the feared move ever arriving. The number describes the expected range over the next 30 days as a whole — it does not put a date on anything, and it is not a countdown timer to a crash.
What it does NOT tell you #4: what will actually happen
The VIX is an expectation, and expectations are usually a little over-cooked. Because the VIX comes from the price of protection — and people happily overpay for insurance against scary outcomes — implied volatility tends to sit above the volatility that actually shows up afterwards. That persistent gap is the “price of fear.”
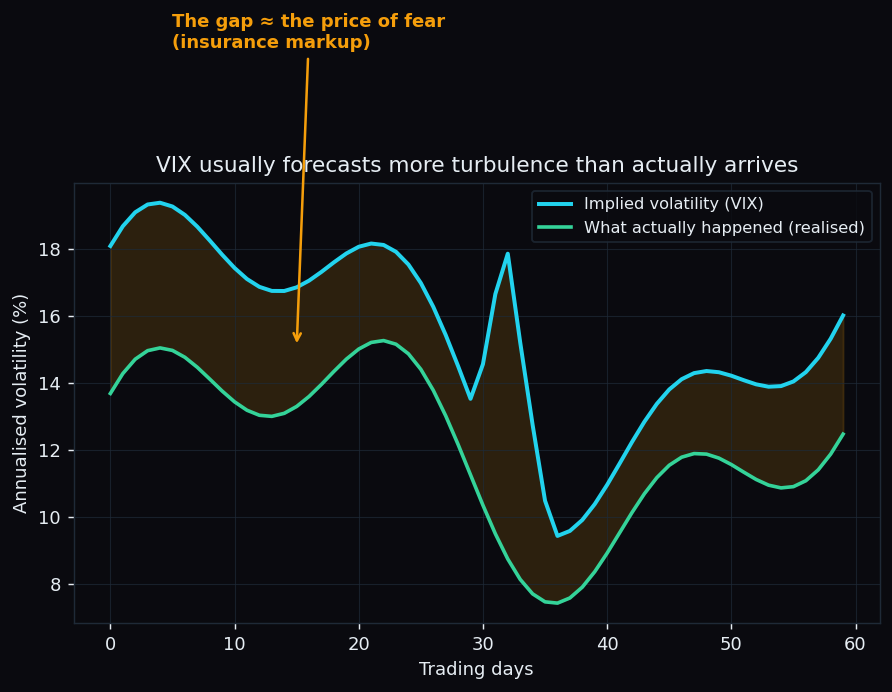
So when the VIX screams 35, it is not a promise that the market will swing that much — it is what the crowd is willing to pay to be protected in case it does. More often than not, the storm is smaller than the forecast.
The honest takeaway: the India VIX is a good thermometer for how much swing the crowd expects — and a terrible compass. It measures the temperature of fear; it does not point north. Use it to size how wide the road might get, never to guess which way it turns.
How to actually use it
Read the VIX as one input among many, not a signal on its own:
- Context, not a call. A rising VIX tells you the market is bracing for wider swings — useful for judging how much room to give a position, not for deciding up or down.
- Always convert it. Apply the rule of 16 before you react, so a scary-looking annual number becomes a realistic daily one.
- Pair it with structure. The VIX tells you the expected size of the move; where support and resistance sit — think option walls, max-pain levels, and positioning — is a separate question the VIX cannot answer.
Volatility tells you how wide the road might get; positioning tells you where the guard-rails are. TrueTrend turns that market structure across Nifty, Bank Nifty and F&O into one clear, at-a-glance read — and scores its own track record in public. See it on the live scoreboard or create a free account.
See these concepts on live market data — free
Create a free TrueTrend account to watch daily support/resistance levels, market regime, and option-positioning charts on NIFTY, BankNifty and 12 more instruments. Every level we publish is scored on a public scoreboard — misses included. No card required.
Free forever tier · daily levels with published hit-rates across every instrument. Descriptive market structure, not investment advice.
Not ready for an account? Get the daily levels by email.
One short email each market day — the indices' call wall, put wall, gamma flip and max pain, and how the last session's levels scored. Free, no account, unsubscribe anytime.
Descriptive market structure, not investment advice. We never share your email.