Williams %R Explained: A Fast Overbought-Oversold Gauge
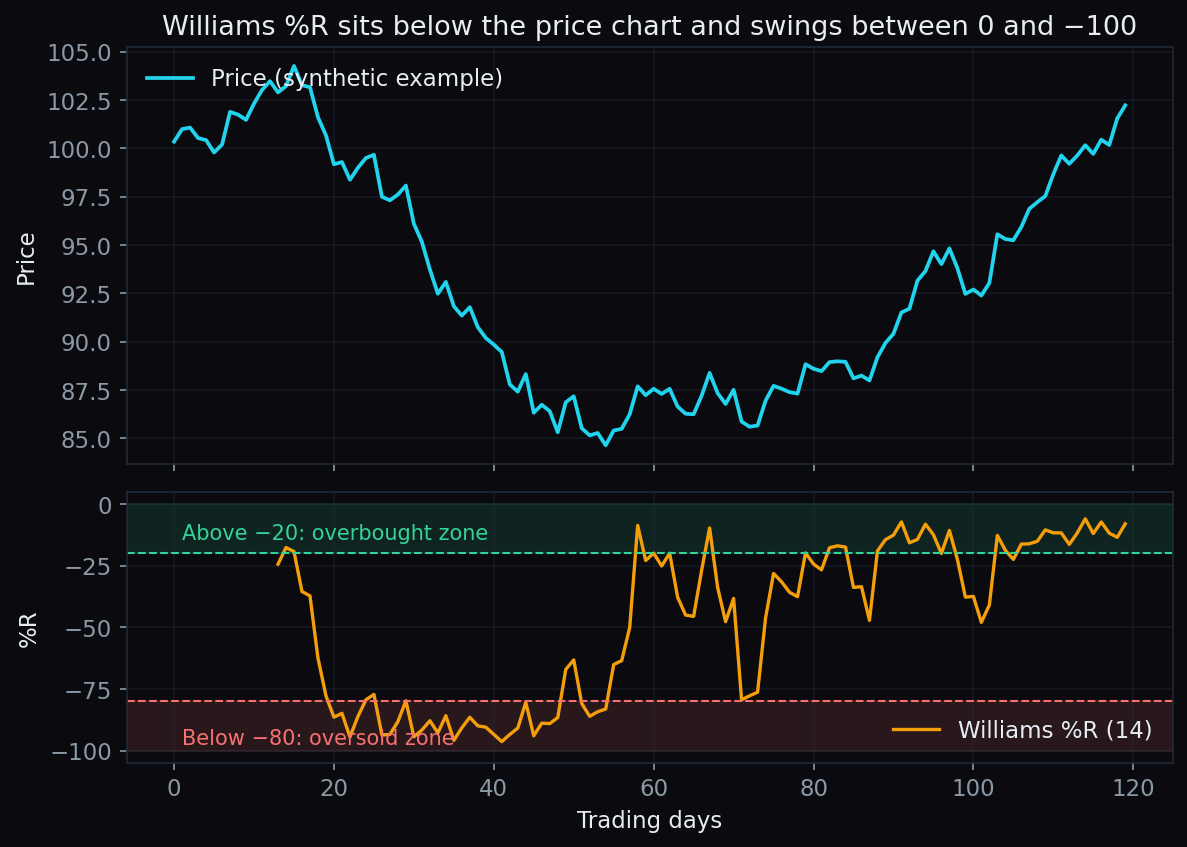
Williams %R asks one simple question: where did today's close land inside the last 14 days' price range? Right at the top of that range, the reading is 0. Right at the bottom, it is −100. Everything the indicator does comes from that one idea — which is why it is one of the fastest and easiest overbought-oversold gauges to learn.
What Williams %R is
Williams %R (say it "percent R") is a momentum oscillator. An oscillator is just an indicator that swings between two fixed limits instead of following price upward forever. This one was popularised by the American trader Larry Williams in the 1970s, and it swings between 0 and −100.
It is drawn in a small panel below the price chart. The standard lookback is 14 periods — on a daily chart, that means the last 14 trading days.
- Above −20 → the close is in the top 20% of the recent range → called overbought.
- Below −80 → the close is in the bottom 20% of the recent range → called oversold.
- In between → neutral territory; the close sits somewhere in the middle of the range.
Note the minus signs: unlike RSI, which runs from 0 to 100, Williams %R runs from 0 at the top to −100 at the bottom. Same idea, upside-down scale.
The lift analogy
Think of a lift in a building. The top floor is the highest high of the last 14 days. The ground floor is the lowest low of the last 14 days. Williams %R simply reports which floor the lift is on right now: 0 means top floor, −100 means ground floor, −50 means exactly halfway.
A worked example with round numbers
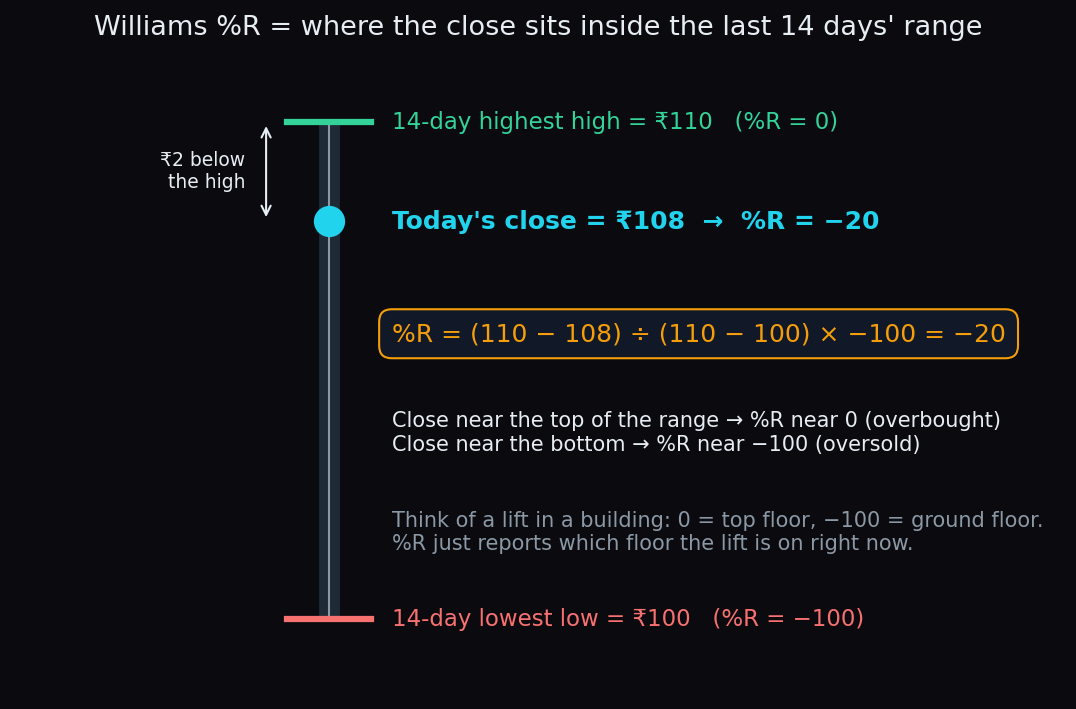
Suppose a stock's last 14 days look like this:
- Highest high of the 14 days: ₹110
- Lowest low of the 14 days: ₹100
- Today's close: ₹108
The formula is:
%R = (Highest High − Close) ÷ (Highest High − Lowest Low) × −100
Plug in the numbers: (110 − 108) ÷ (110 − 100) × −100 = 2 ÷ 10 × −100 = −20. The close sits ₹2 below a ₹10-tall range — in the top fifth of it — so the reading lands exactly on the overbought line.
Why traders call it "fast"
Williams %R is nearly identical to the stochastic oscillator — it is the stochastic's raw %K line flipped onto a 0 to −100 scale. The key difference: the common stochastic adds a smoothing average on top, while Williams %R is usually shown raw, with no smoothing. No smoothing means no lag — the reading jumps the moment price moves. That makes it quick to flag a stretch to either extreme, and equally quick to whipsaw (flip back and forth) on noisy days.
Common ways traders read it (descriptively — none of these is a prediction):
- Exit from an extreme. A move from below −80 back above it shows the close has lifted off the floor of its range; some watch the same exit from above −20 on the other side.
- Divergence. Price makes a new high but %R makes a lower high — the close is no longer finishing near the top of its range, a sign the push is losing force.
- Midline. Readings holding above −50 suggest closes in the upper half of the recent range; below −50, the lower half.
The honest catch: "overbought" is not a stop sign
Here is where beginners get hurt. In a strong trend, price keeps closing near the top of its rolling range day after day — so %R stays pinned above −20 for weeks while price keeps climbing. The overbought label describes where the close sits in its range, not whether the move must end.
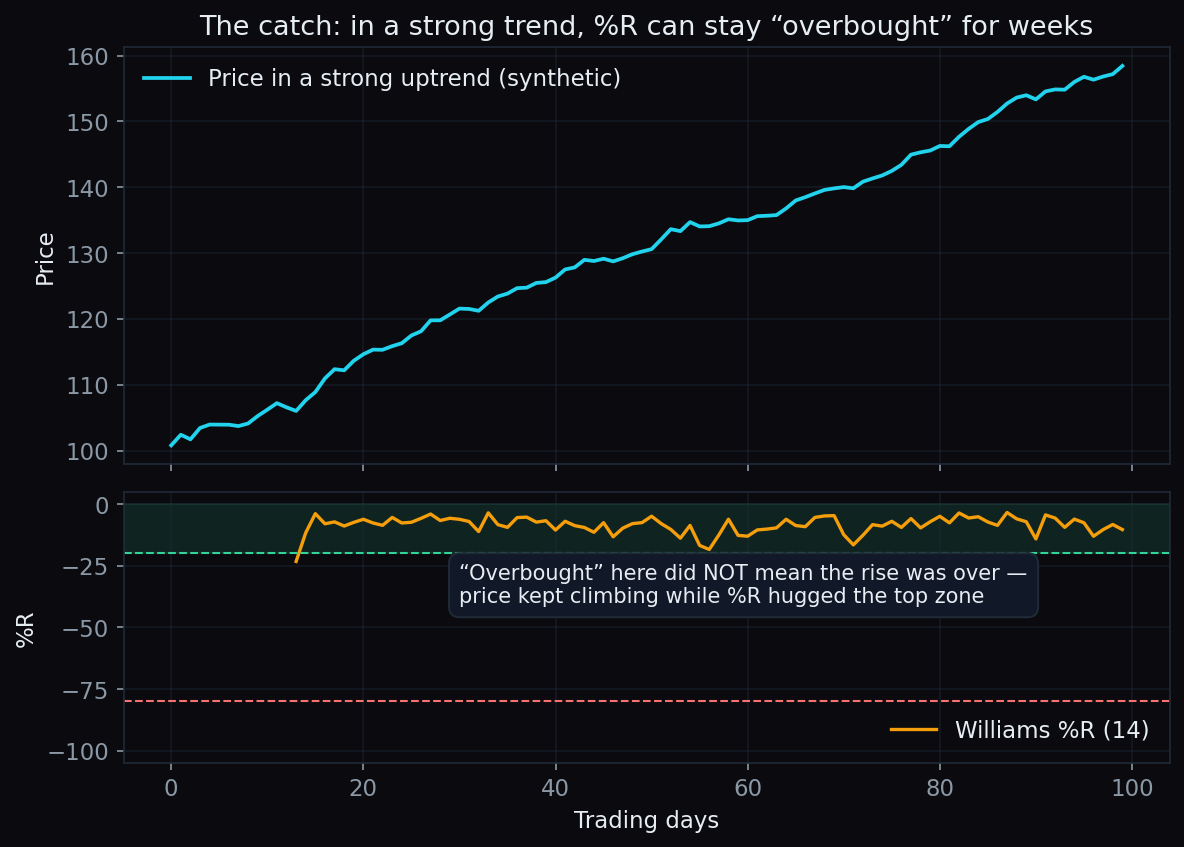
Because of that, %R behaves best in sideways, range-bound markets, where the extremes genuinely mark the edges of the box. In trending markets, fading every overbought reading means standing in front of the trend. That is why it is usually paired with a trend filter — for example, a moving average to establish direction first — and read as context, not as an instruction.
Two more limits worth knowing: with only 14 days of data, one big spike can stretch the range and distort the reading for two weeks; and like every range-based gauge, %R says nothing about why price is where it is.
Quick recap
- Williams %R = where the close sits inside the last 14 days' high-low range, scaled 0 (top) to −100 (bottom).
- Above −20 is called overbought; below −80 is called oversold.
- It is raw and unsmoothed, so it reacts instantly — and whipsaws easily.
- In strong trends it can stay pinned at an extreme for weeks; it is a description of range position, not a forecast.
Indicators like Williams %R describe one slice of market structure. TrueTrend pulls the bigger picture together — positioning, levels and market regime across Nifty, Bank Nifty and F&O — into one clear, at-a-glance read, and scores its own track record in public. Create a free account to see it live.
See these concepts on live market data — free
Create a free TrueTrend account to watch daily support/resistance levels, market regime, and option-positioning charts on NIFTY, BankNifty and 12 more instruments. Every level we publish is scored on a public scoreboard — misses included. No card required.
Free forever tier · daily levels with published hit-rates across every instrument. Descriptive market structure, not investment advice.
Not ready for an account? Get the daily levels by email.
One short email each market day — the indices' call wall, put wall, gamma flip and max pain, and how the last session's levels scored. Free, no account, unsubscribe anytime.
Descriptive market structure, not investment advice. We never share your email.