The Calendar Spread Explained: A Simple Illustrative Example
A calendar spread pairs two options at the same strike but with two different expiry dates — the nearer one is sold, the farther one is bought. In the worked example below it costs ₹150 to set up, and that ₹150 is also roughly the most it can lose. Here is the whole idea, explained simply with round numbers.
First, the two building blocks
An option is a contract you pay for today (the price is called the premium) for a right that lives until a fixed date (the expiry). A call option, for example, gains value when the index rises above its strike price — the level written into the contract. If any of that is new, start with our plain-language guide to calls and puts.
The key fact for this post: part of every option's premium is time value — money paid for the time remaining on the clock. Time value melts away every day, a process called theta decay (covered in detail in our theta explainer). Crucially, it does not melt at one steady speed.
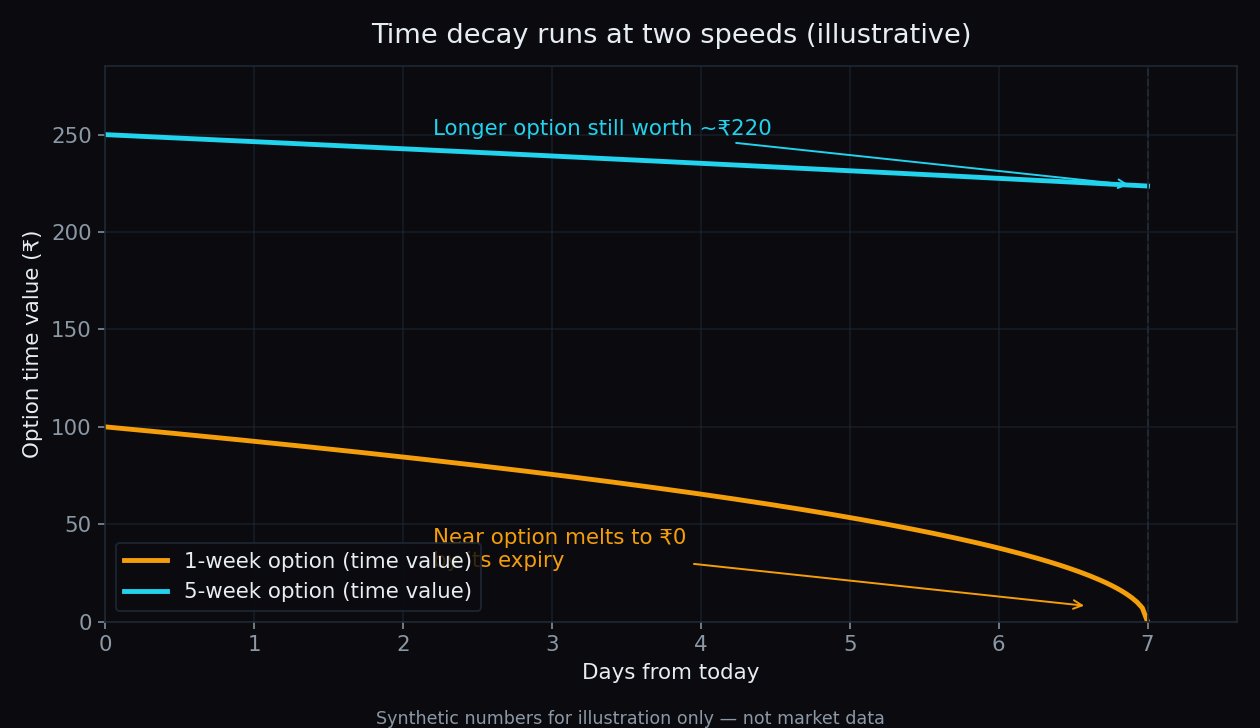
The engine: time decay runs at two speeds
Think of two pieces of ice on a summer day. A small ice cube in direct sun is gone in minutes. A large ice block in the shade loses water slowly, drop by drop. An option close to expiry is the ice cube: its time value collapses fast in its final days. An option with weeks left is the ice block: it melts too, but gently.
A calendar spread is built to collect the difference between those two melting speeds. It holds the slow-melting option and is short the fast-melting one, so the fast melt works for the position while the slow melt works only mildly against it.
One spread, two legs
The structure is just two legs at the same strike:
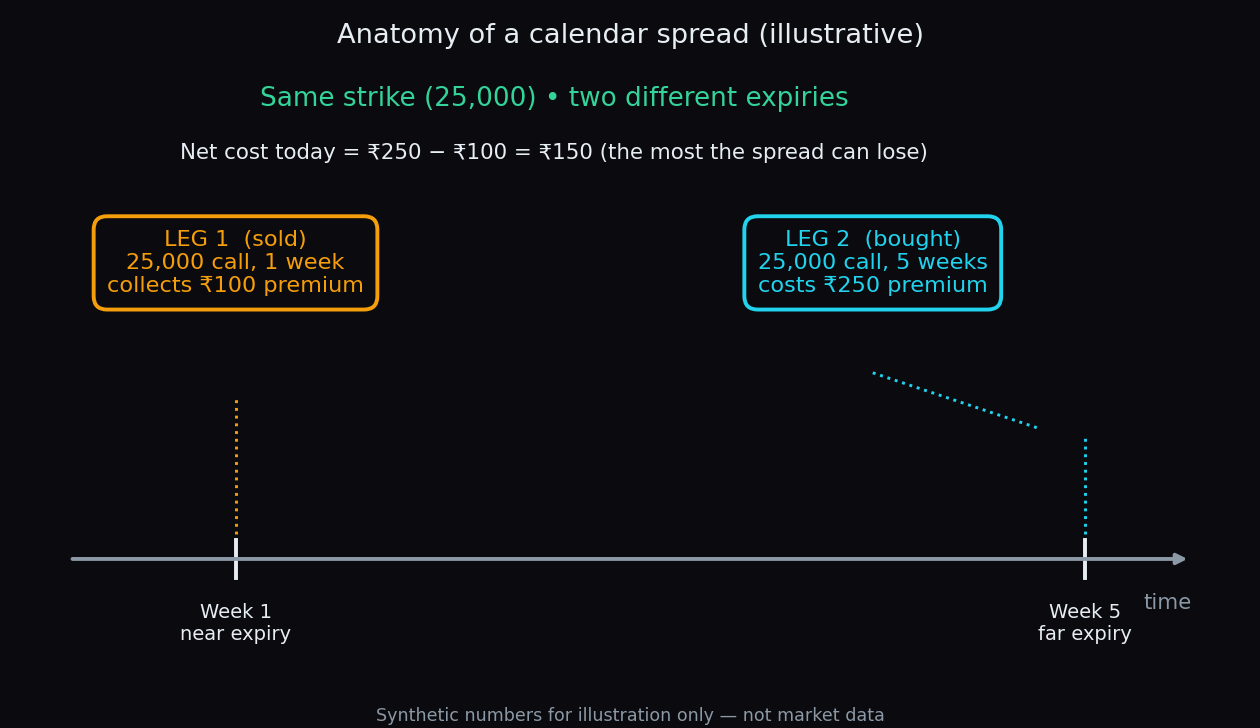
Because the longer-dated option always costs more than the nearer one, setting up a calendar spread means paying money out of pocket on day one. That outflow is called the net debit, and it defines the risk: in the standard version of this structure, the debit (plus transaction costs) is approximately the maximum possible loss.
A worked example with simple numbers
Say the index trades at 25,000. All numbers are invented to keep the arithmetic easy:
- Leg 1 (sold): one 25,000-strike call expiring in one week is sold, collecting ₹100 of premium.
- Leg 2 (bought): one 25,000-strike call expiring in five weeks is bought, costing ₹250.
- Net cost: ₹250 − ₹100 = ₹150. This is the debit, and roughly the maximum the position can lose.
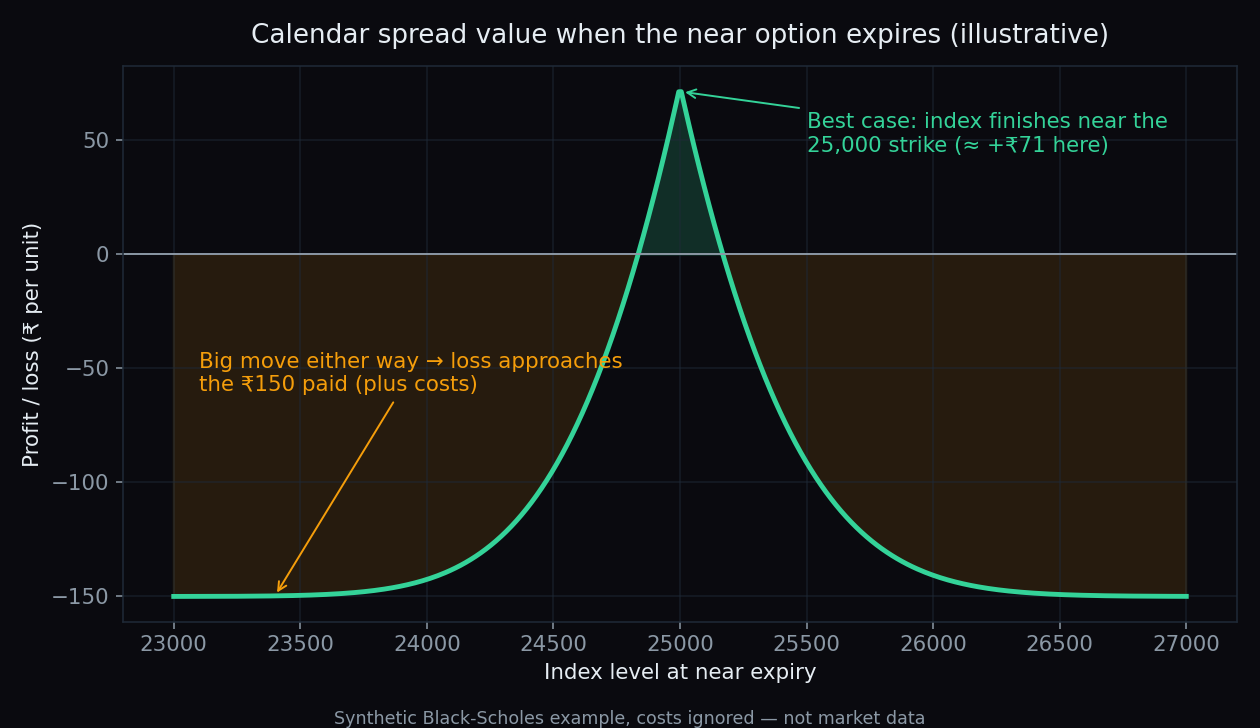
Now fast-forward one week and suppose the index is still near 25,000. The sold one-week call expires worthless — its entire ₹100 of time value has melted, which is exactly what the spread was set up to collect. The five-week call, now a four-week call, has melted only a little: in this illustration it is still worth about ₹220. So the position holds an option worth about ₹220 that cost a net ₹150 — a gain of roughly ₹70 per unit in this tidy example. (Index options trade in lots, so real amounts multiply by the lot size, and brokerage and taxes eat into everything.)
The honest catch
That tent-shaped picture makes the risk plain: the spread only does well if the index stays near the strike until the near expiry. Several things can go wrong:
- A big move either way. If the index runs far above or far below 25,000, the two legs start behaving almost identically and the spread's value shrinks toward zero. The loss then approaches the full ₹150 paid.
- Falling volatility. The long, far-dated leg is sensitive to implied volatility — the market's priced-in expectation of movement. If that expectation drops, the far leg cheapens and the spread loses value even if the index sits perfectly still.
- Two legs, double the friction. Every calendar spread crosses two bid–ask spreads and pays two sets of charges — on the way in and again on the way out.
- Nothing finishes politely on schedule. The example assumed the index closed exactly at 25,000. Real expiry days are messier — see how Indian expiry days actually behave.
Key takeaway: a calendar spread is a defined-risk structure that gains from time passing quietly, not from predicting direction. Its maximum loss is known on day one (the net premium paid, plus costs); its best case needs the index to stay near the strike — something no one can promise in advance.
Why Indian index options make this vivid
India's index options have weekly expiries, so at any moment there is a near-dated contract whose time value is melting at ice-cube speed while the monthly and next-month contracts melt at ice-block speed. That is why the calendar spread shows up so often in Indian options education: the two speeds of decay are on display in the option chain every single week. None of this is a recommendation — it is a structure to understand, with a risk profile you can now read straight off the pictures above.
Understanding a structure is easier when you can see the market's positioning behind it. TrueTrend turns live Nifty and Bank Nifty option data into a clear, at-a-glance read — and scores its own track record in public instead of selling predictions. Create a free account to explore it.
See these concepts on live market data — free
Create a free TrueTrend account to watch daily support/resistance levels, market regime, and option-positioning charts on NIFTY, BankNifty and 12 more instruments. Every level we publish is scored on a public scoreboard — misses included. No card required.
Free forever tier · daily levels with published hit-rates across every instrument. Descriptive market structure, not investment advice.
Not ready for an account? Get the daily levels by email.
One short email each market day — the indices' call wall, put wall, gamma flip and max pain, and how the last session's levels scored. Free, no account, unsubscribe anytime.
Descriptive market structure, not investment advice. We never share your email.