The Dollar Index (DXY): Why a Strong Dollar Hurts India
In 2022, the US dollar index — DXY for short — climbed past 110, its highest level in roughly two decades. In the same stretch, the rupee slipped past 80 to a dollar for the first time, and foreign investors pulled money out of Indian stocks at a near-record pace. That was not a coincidence. The DXY is one of the most watched numbers in global markets, and when it runs hot, Indian equities usually feel the squeeze. This post explains what the DXY actually measures, the three routes through which a strong dollar reaches the Nifty, and the honest limits of using it as a signal.
What is the dollar index (DXY)?
The dollar index is a single number that answers a simple question: is the US dollar strong or weak right now, overall? Instead of comparing the dollar to one currency at a time, it compares the dollar to a fixed basket of six major currencies and averages the result into one score. The index was created in 1973 with a starting value of 100, so a reading of 104 means the dollar is about 4% stronger against that basket than it was at the start.
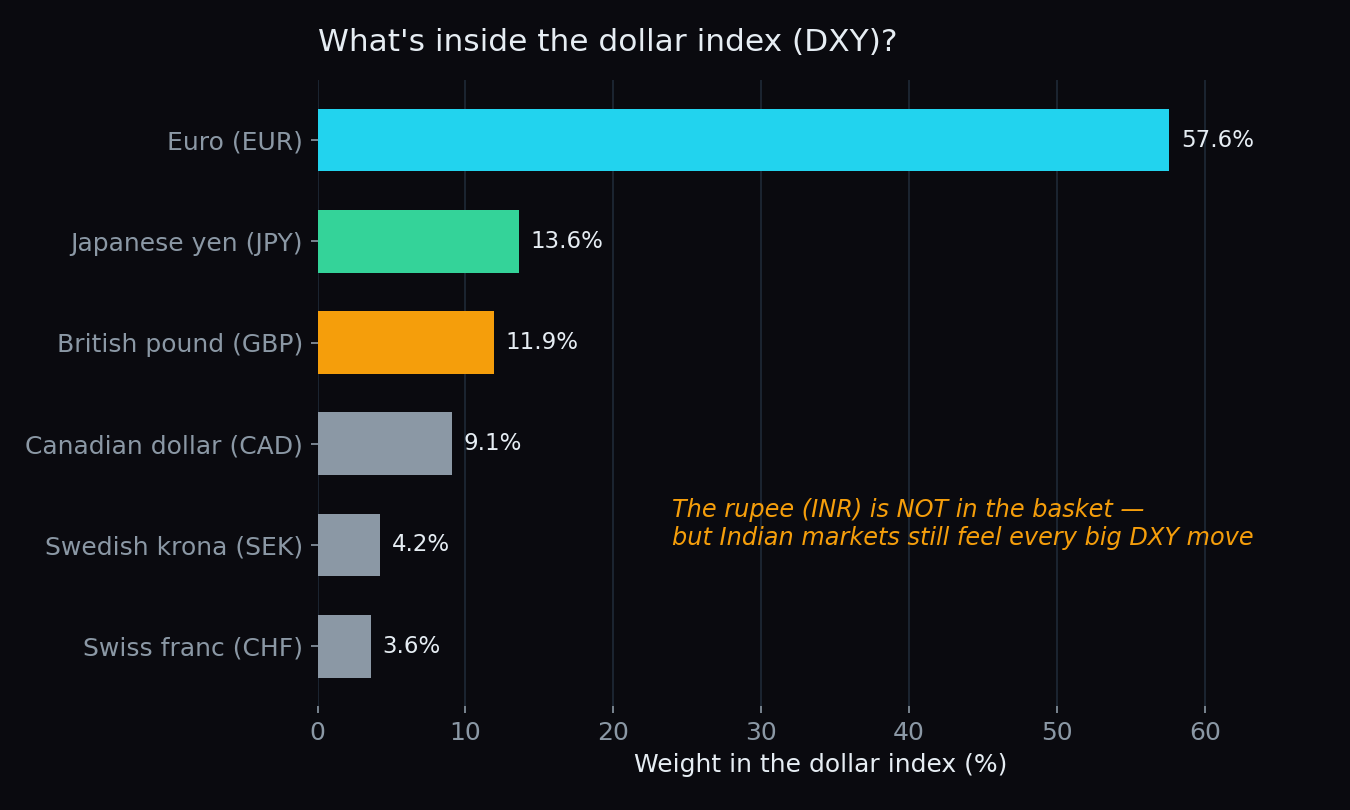
The basket is heavily tilted toward the euro, which alone carries a 57.6% weight. The Japanese yen, British pound, Canadian dollar, Swedish krona and Swiss franc make up the rest. Notice what is missing: the Indian rupee, the Chinese yuan, and every other emerging-market currency. The DXY is a rich-world index — and yet it moves markets in Mumbai. We will see why in a moment.
A simple analogy: the dollar’s report card
Think of the DXY as a report card with six subjects. Each subject is one currency, and the grade is how the dollar is doing against it. The index is the weighted average — one number that summarises the whole card. Just as a student can slip in one subject and still post a strong average, the dollar can weaken against the yen on a given day and the DXY can still rise if it gained against the euro, the heavyweight subject. When traders say “the dollar is strong,” they almost always mean this average, not any single currency pair.
The rupee is not in the basket — so why does India care?
Because the DXY is shorthand for global dollar strength. The dollar is the currency in which most world trade is priced, most commodities (including crude oil) are quoted, and most cross-border investment is measured. When the dollar strengthens against the six basket currencies, it is usually strengthening against the rupee too — the same forces (higher US interest rates, global nervousness, money seeking safety) push all of these pairs in the same direction. So a rising DXY is an early, visible symptom of pressure that shows up in USD/INR as well.
The three routes from a strong dollar to Indian stocks
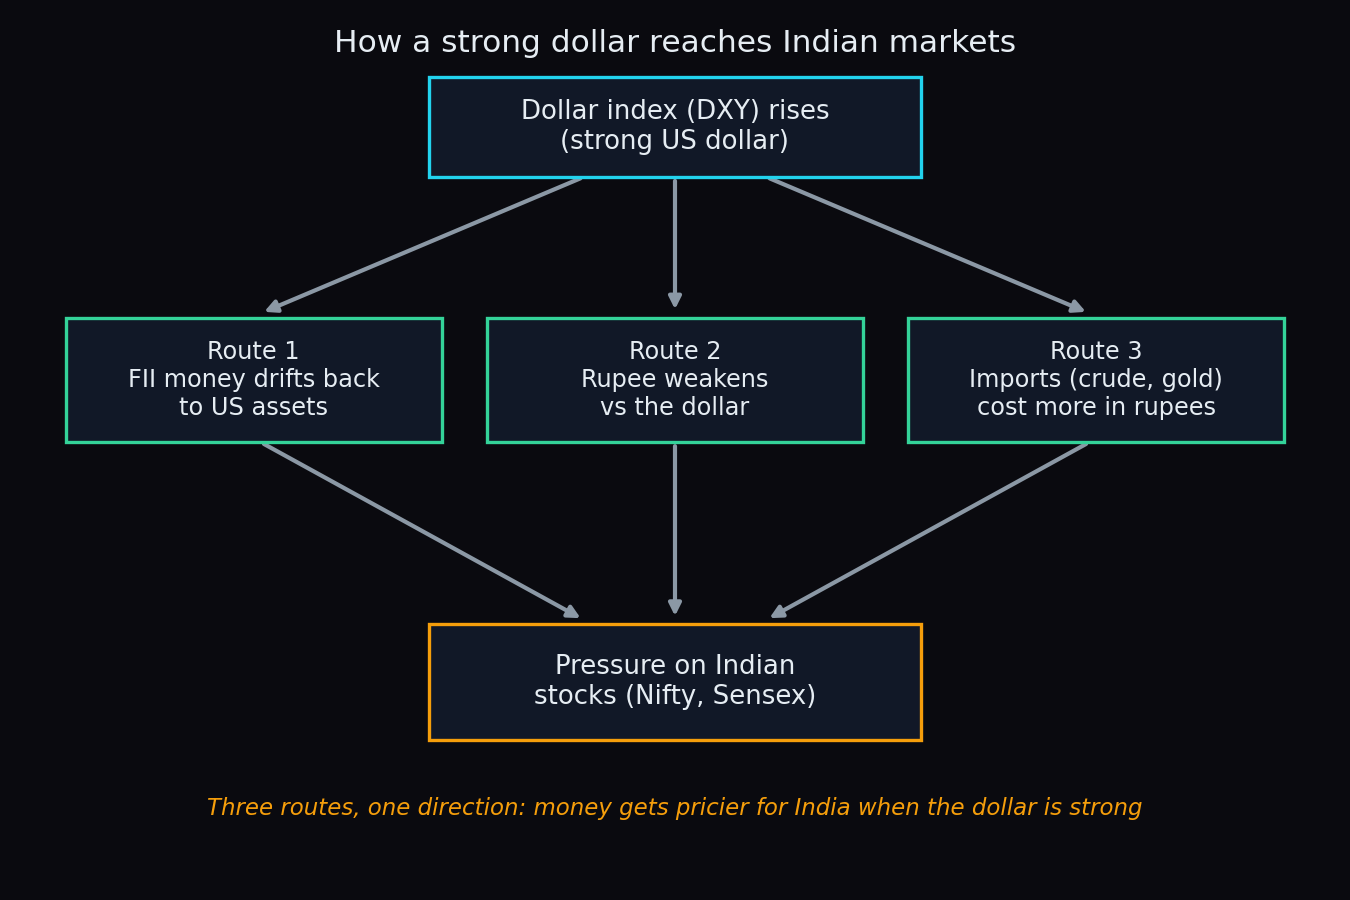
Route 1: Foreign investor flows
Foreign institutional investors (FIIs) — the large overseas funds that invest in Indian markets — keep score in dollars, not rupees. A strong dollar usually travels with higher US interest rates, which means US government bonds start paying more for taking very little risk. When that happens, some money that had travelled to emerging markets like India drifts back home. Sustained FII outflows remove a steady source of demand from Indian equities, which is why stretches of dollar strength so often overlap with stretches of FII withdrawal. We looked at who actually moves Indian markets in our FII vs DII data post.
Route 2: A weaker rupee
Dollar strength and rupee weakness are two sides of the same coin. When the DXY rises, USD/INR usually rises too — each dollar costs more rupees. A sliding rupee makes everything India imports more expensive in rupee terms, feeds into inflation, and can force the Reserve Bank of India to respond. For a foreign investor, it also quietly eats their returns — the worked example below shows how brutally simple that math is.
Route 3: Costlier imports
India imports the bulk of the crude oil it consumes, and crude is priced in dollars. When the dollar strengthens, India pays more rupees for the same barrel — and if crude prices are rising at the same time, the pain compounds. Costlier oil widens India’s trade deficit (the gap between what the country imports and exports), which itself puts further pressure on the rupee — a feedback loop. We covered the oil side of this in crude oil and Indian markets.
A worked example with simple round numbers
Here is why FIIs watch the DXY so closely. Imagine a foreign fund converts $100 into rupees at ₹80 per dollar, giving it ₹8,000, and puts that into an index position.
- The index rises 5%. The position is now worth ₹8,400. In rupees, a tidy gain.
- But over the same period the dollar strengthens and the rupee slides from ₹80 to ₹84 per dollar — a 5% move.
- Converting back: ₹8,400 ÷ 84 = $100. The entire 5% gain vanished in the exchange rate.
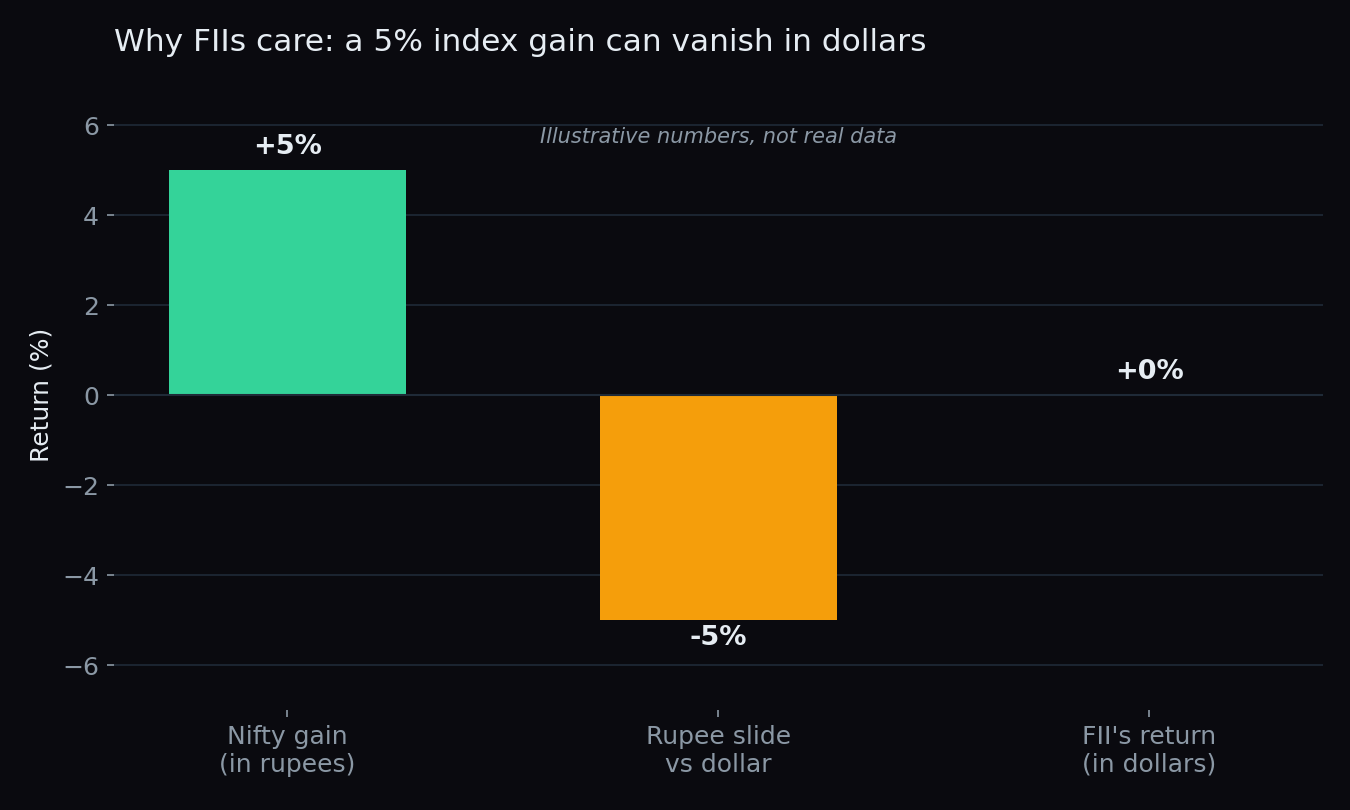
The numbers here are illustrative, but the mechanism is exactly real: an FII’s return is the index move minus the rupee’s slide. When the dollar looks likely to keep strengthening, staying invested in rupee assets becomes a harder case to make in a dollar-denominated report — even if the Indian market itself is doing fine.
Who actually gains from a strong dollar?
Not everyone in the Indian market suffers. Companies that earn in dollars but spend in rupees — classically IT services and parts of pharma — receive more rupees for the same dollar revenue when the currency slides. This is why, on strong-dollar days, export-heavy sectors sometimes hold up while the broader index struggles. The dollar index does not push every stock the same way; it redistributes pressure across the market.
The honest catch
The DXY–India relationship is a tendency, not a law. Three limits are worth keeping in mind:
- The DXY can rise for reasons that say little about India. Because the euro is 57.6% of the basket, a euro-specific problem can lift the DXY even when the dollar is calm against Asian currencies.
- Domestic flows can cushion the blow. In recent years, steady inflows from Indian mutual funds and SIP investors have often absorbed FII outflows, muting a channel that used to dominate.
- Timing is loose. The dollar index is a slow, macro-level cue. It shapes the backdrop over weeks and months; it says very little about what the Nifty does tomorrow morning.
A rising dollar index is a headwind, not a verdict. It tells you which way the global wind is blowing for Indian equities — through FII flows, the rupee and import costs — but it does not decide any single day, and it punishes anyone who treats it as a precise timing tool.
Used that way — as context, not prophecy — the DXY is one of the most useful single numbers an Indian market watcher can track alongside US market cues and local positioning data.
Global cues like the dollar index set the backdrop — but the day’s actual battle lines show up in positioning. TrueTrend turns Nifty and Bank Nifty options data into a clear, at-a-glance read of market structure, and scores its own track record in public on the scoreboard.
See these concepts on live market data — free
Create a free TrueTrend account to watch daily support/resistance levels, market regime, and option-positioning charts on NIFTY, BankNifty and 12 more instruments. Every level we publish is scored on a public scoreboard — misses included. No card required.
Free forever tier · daily levels with published hit-rates across every instrument. Descriptive market structure, not investment advice.
Not ready for an account? Get the daily levels by email.
One short email each market day — the indices' call wall, put wall, gamma flip and max pain, and how the last session's levels scored. Free, no account, unsubscribe anytime.
Descriptive market structure, not investment advice. We never share your email.