Gamma Exposure (GEX): Why Dealer Hedging Pins Some Days and Fuels Others
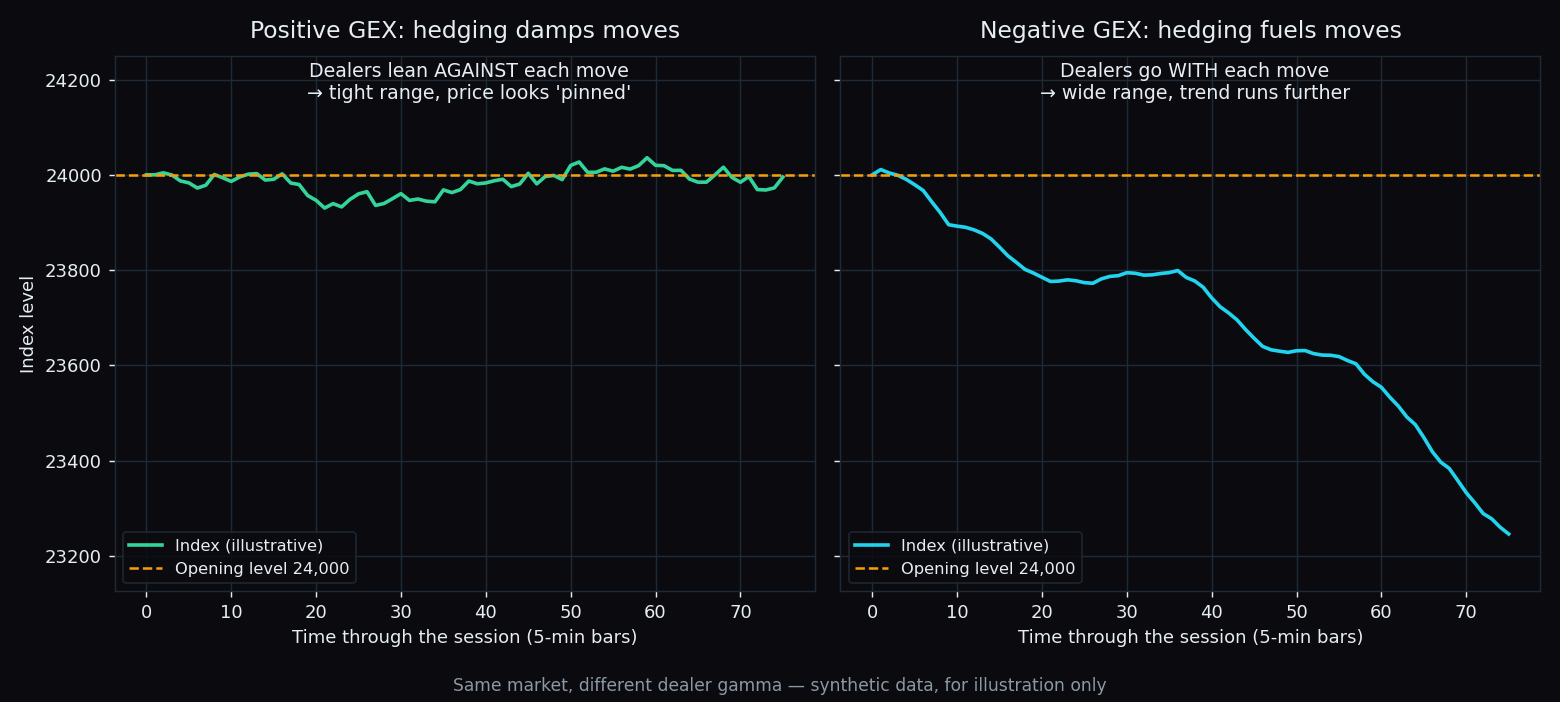
Some trading days, Nifty opens near 24,000 and spends six hours wandering within a few dozen points of it. Other days, a 50-point dip turns into a 300-point slide with barely a pause. Same index, same participants, very different behaviour. One of the forces behind that difference has a name: gamma exposure, or GEX. This post explains what it is, why it can act like a brake on some days and an accelerator on others, and what TrueTrend’s own data says about how far you can lean on it.
First, two quick definitions
Delta is how much an option’s price moves when the index moves one point. A delta of 0.5 means the option gains roughly half a point for every one-point rise. (Full explainer: option delta.)
Gamma is how fast delta itself changes as the index moves. If gamma is 0.001, then a 100-point rise pushes delta up by about 0.1 — from 0.5 to 0.6. Gamma is highest for options whose strike is close to the current index level, and it grows sharply as expiry gets near. (Full explainer: option gamma.)
In this post, dealers means the professional desks — market makers, proprietary firms, institutions — that sit on the other side of a large share of option trades and keep their overall risk close to zero by trading index futures all day. That constant re-balancing is called delta hedging.
The analogy: a shock absorber or a trampoline
Picture a car driving over a bumpy road. A good shock absorber pushes back against every bump, so the ride stays smooth. A trampoline does the opposite: every bounce sends you higher than the last.
Dealer hedging can play either role. Which one depends on whether dealers, taken together, are long gamma (they own more of the options near the current price) or short gamma (they have written more of them). Gamma exposure is simply the scoreboard of which way that balance tilts, and by how much.
A worked example with round numbers
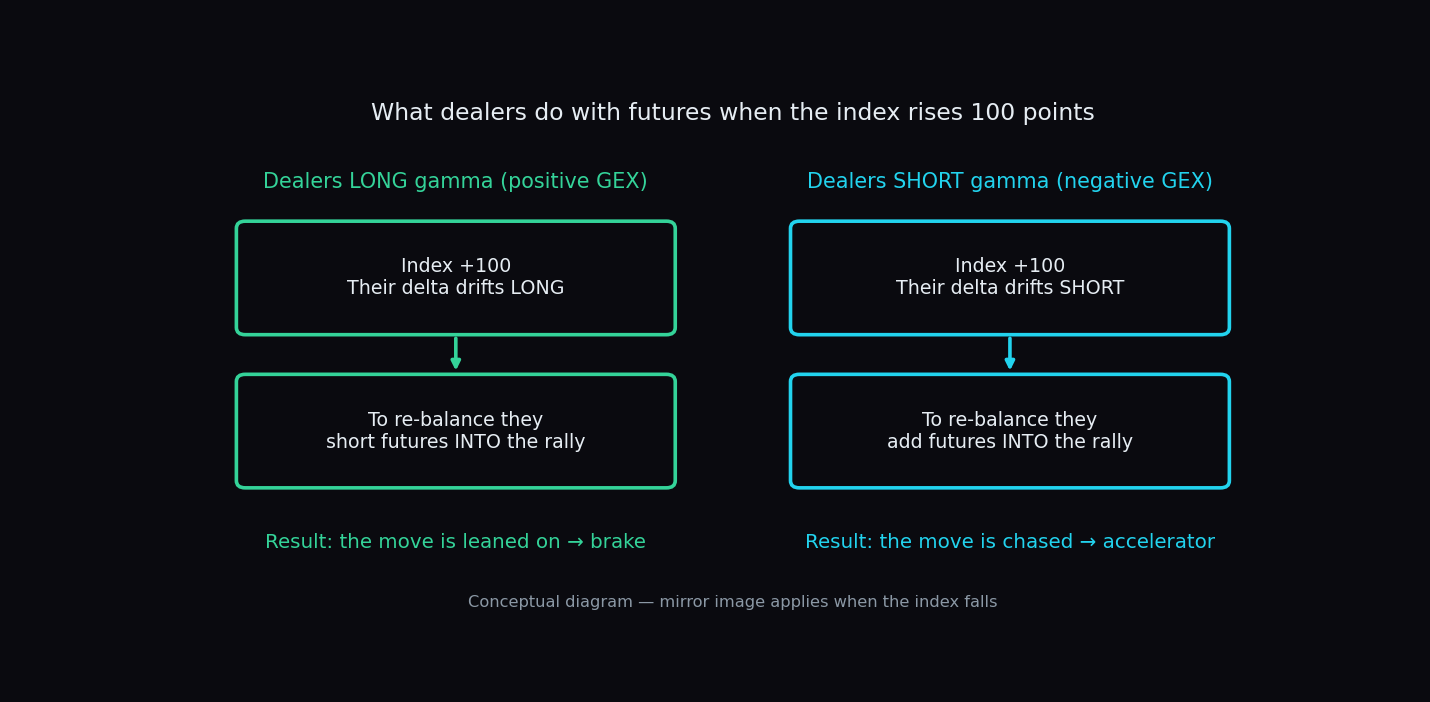
Say a dealer holds call options covering 1,00,000 units of Nifty, at a 24,000 strike. Delta is 0.5 and gamma is 0.001. To be neutral, the dealer holds a short futures position of 50,000 units, cancelling the options’ 50,000-unit long exposure.
- Index rises 100 points to 24,100. Delta climbs to 0.6, so the options now behave like 60,000 units long. The dealer is 10,000 units too long and shorts 10,000 more futures — into the rally.
- Index falls back 100 points to 24,000. Delta drops to 0.5 again. The dealer is now 10,000 units too short and covers them — purchasing futures into the dip.
Notice the pattern: this dealer is always trading against the move. Up-moves meet extra supply, down-moves meet extra demand. That is the shock absorber. Now flip it: if the dealer had written those calls instead, every step reverses. A rally forces them to add futures into strength, a fall forces them to shed futures into weakness. That is the trampoline.
One desk moving 10,000 units does not steer Nifty. But the same logic applies to every desk holding every strike at once, and near expiry the combined flow can be large enough to matter.
So what exactly is GEX?
Gamma exposure adds this up across the whole option chain. For each strike, analysts take the option’s gamma, the open interest at that strike, and the index level, and estimate how much futures dealers would need to trade if the index moved 1%. A common formula is:
GEX at a strike ≈ gamma × open interest (in units) × index level × (1% of index level)
Worked through with round numbers: gamma 0.001, open interest of 10,00,000 units, Nifty at 24,000. A 1% move is 240 points, so delta shifts by 0.001 × 240 = 0.24 per unit. Across 10,00,000 units that is 2,40,000 units of hedging, which at 24,000 is roughly ₹576 crore of futures flow — from one strike, for a single 1% move. (Gamma is not perfectly constant over 240 points, so treat this as a ballpark.)
Sum that number across every strike, with a sign attached, and you get the net GEX:
- Positive net GEX — dealers are net long gamma. Their hedging leans against moves. Ranges tend to be tighter, and price often hovers near the strikes with the heaviest open interest. These are the “pinned” days.
- Negative net GEX — dealers are net short gamma. Their hedging chases moves. Ranges tend to widen and a push in one direction can feed on itself. These are the “fuelled” days.
The gamma flip: where the brake turns into an accelerator
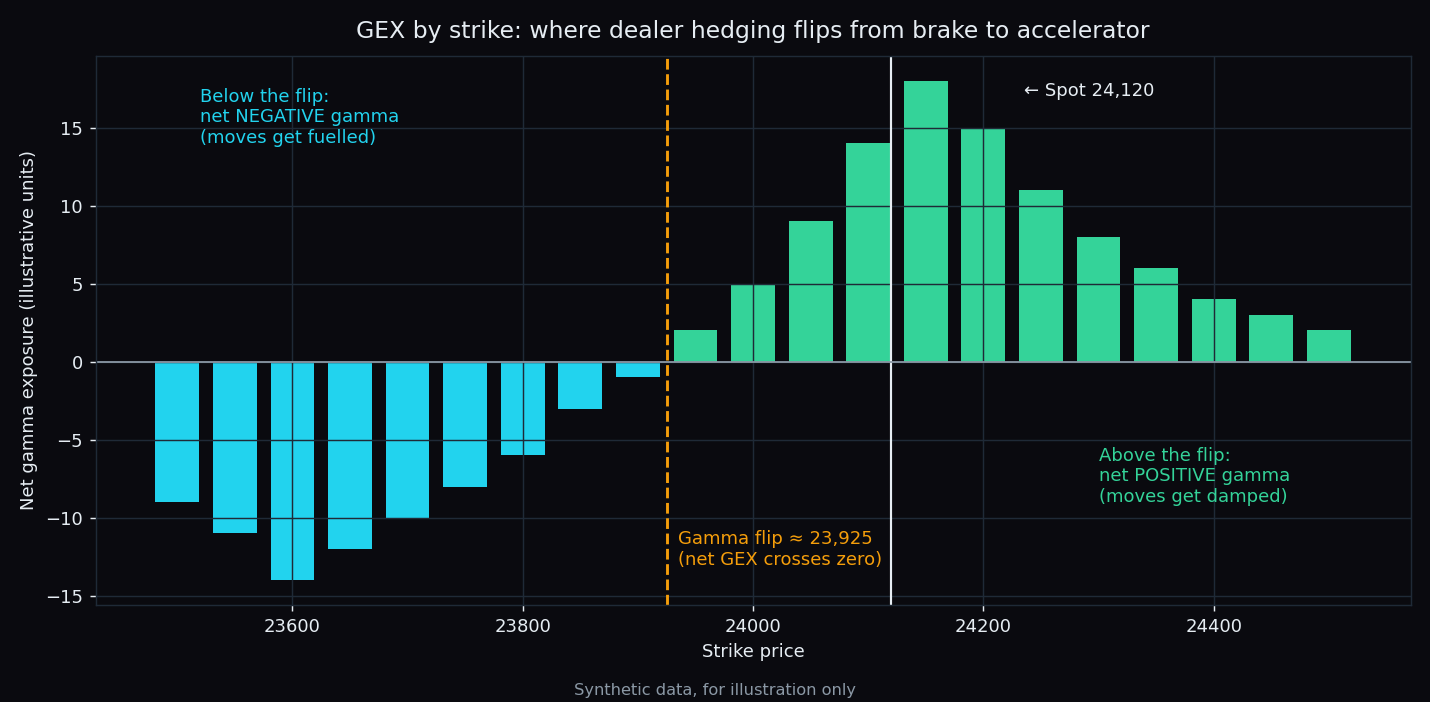
GEX changes as the index moves, because gamma depends on how close each strike is to the current price. Somewhere on the chain there is usually a level where net GEX crosses zero. That level is called the gamma flip.
- With the index above the flip (in the usual set-up), net gamma is positive and dealer hedging tends to calm things down.
- If the index falls through the flip, net gamma turns negative and the same hedging starts adding fuel.
This is why many desks watch the flip closely: it marks a possible change in the character of the session, not a price the market must reach.
Why expiry days feel different
Gamma for near-the-money options rises steeply in the last day or two before expiry. That makes the hedging flows around the biggest strikes much larger. When dealers are long that gamma, the index can look magnetised to a round strike into the close. When they are short it, a break away from that strike can snowball fast. It is the same mechanic on both days — just with the volume turned up. (More on the weekly calendar: Nifty and Sensex expiry days.)
What our own data says (and what it doesn’t)
TrueTrend scores its levels in public on the Scoreboard. Every session, levels are computed from the option chain at about 09:30 IST and then graded against the rest of the day, misses included. Current figures:
- Gamma flip, “side respected to close”: Nifty 100% (n=84 sessions), Bank Nifty 92% (n=89 sessions).
- Max pain, “closed within 1 strike”: Nifty 42% (n=90 sessions), Bank Nifty 14% (n=90 sessions).
- Option walls, “held when touched”: Nifty call wall 75% (n=20 touches), Nifty put wall 62.5% (n=32 touches), Bank Nifty call and put walls 64% each (n=14 touches each).
Read the gamma-flip number carefully. It looks spectacular, but it is mechanically inflated: on many mornings the flip sits far away from spot, so the index would have to travel a long way to cross it. “Stayed on the same side” is then close to automatic. It tells you the flip is a sensible regime marker, not that it is a 100% edge.
The max-pain figures are the useful reality check on “pinning”. If dealer hedging reliably glued the index to one strike, closes within one strike of max pain would be common. On Bank Nifty it happened in 14% of 90 sessions. Pinned days are real, but they are one outcome among several, not the default. (Deeper dive: does price gravitate to max pain? and do option walls hold?)
The honest catch
- GEX is an estimate built on an assumption. The exchange publishes open interest, not who holds which side. Most GEX models assume a fixed split — for example, that dealers are long calls and short puts — and attach signs accordingly. If the real positioning differs, the sign of GEX can be wrong.
- It is a snapshot. Open interest and gamma change through the day. A morning reading can go stale by afternoon.
- Other forces are bigger on news days. A policy announcement, a sharp overnight fall in global markets or heavy FII flows can overwhelm hedging flows entirely. (See how global cues move Nifty.)
- It describes conditions, not direction. Positive GEX suggests calmer ranges; negative GEX suggests wider ones. Neither says whether the index will close up or down.
Key takeaway: GEX tells you whether dealer hedging is more likely to act as a shock absorber or a trampoline today. It is a read on the kind of day, not a forecast of the close — and our own 90-session data shows “pinning” is far from a sure thing.
Want this read without doing the maths every morning? TrueTrend turns the option chain into a clear, at-a-glance picture of positioning — walls, flip level and regime — across Nifty, Bank Nifty and F&O stocks, with every level scored in public. Create your TrueTrend account.
See these concepts on live market data — free
Create a free TrueTrend account to watch daily support/resistance levels, market regime, and option-positioning charts on NIFTY, BankNifty and 12 more instruments. Every level we publish is scored on a public scoreboard — misses included. No card required.
Free forever tier · daily levels with published hit-rates across every instrument. Descriptive market structure, not investment advice.
Not ready for an account? Get the daily levels by email.
One short email each market day — the indices' call wall, put wall, gamma flip and max pain, and how the last session's levels scored. Free, no account, unsubscribe anytime.
Descriptive market structure, not investment advice. We never share your email.