How to Read a Quarterly Results Announcement: A Beginner's Checklist
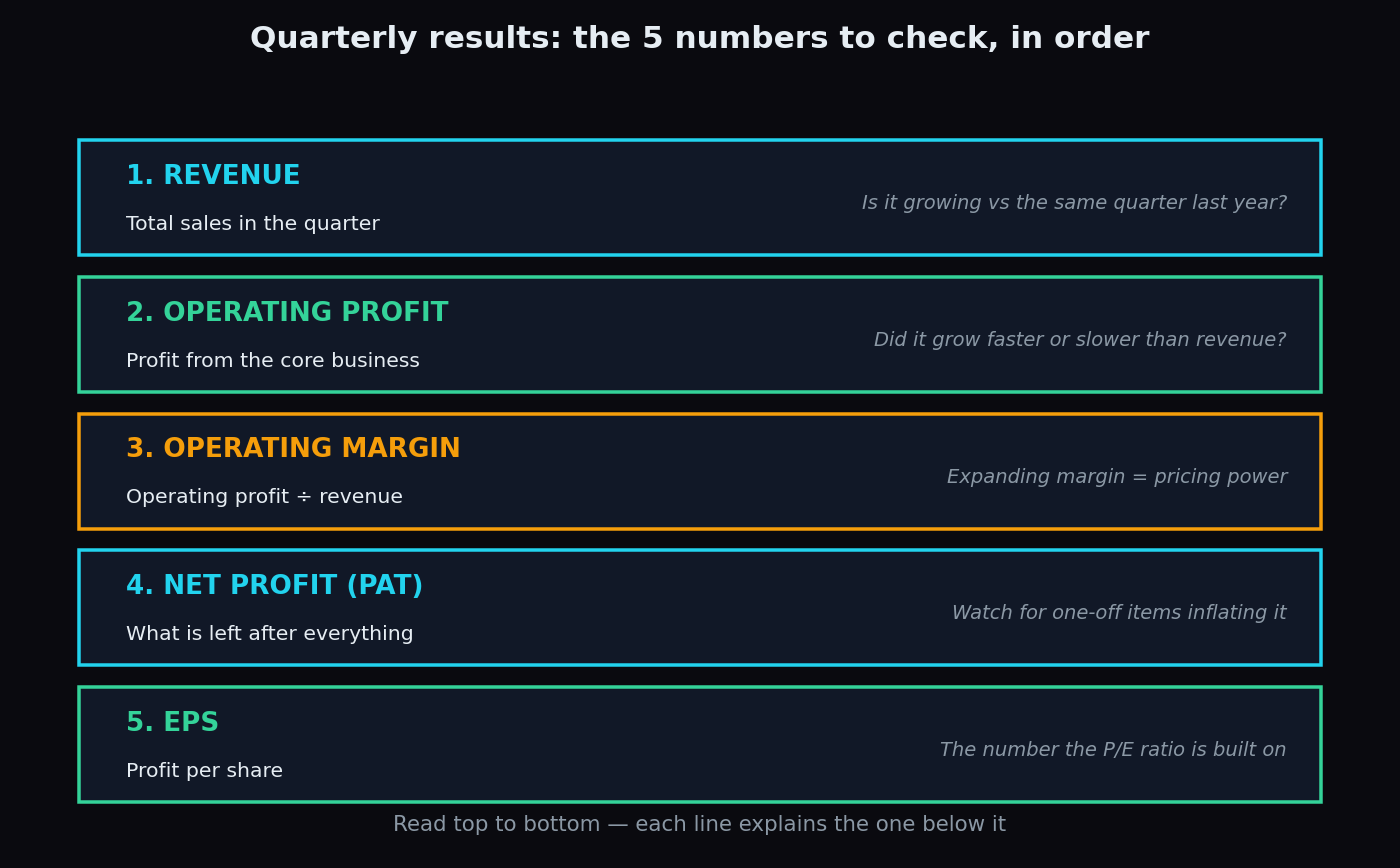
A quarterly results announcement is a company’s report card. Just as a school hands out a report card every term, every listed company in India must publish its financial results every three months. The document looks intimidating — but a beginner can get most of the value from just five numbers and three habits. This checklist walks through them with a simple worked example.
What a quarterly results announcement is
India’s financial year runs April to March, split into four quarters: Q1 (April–June), Q2 (July–September), Q3 (October–December) and Q4 (January–March). Under SEBI’s listing rules, a listed company must file its results with the stock exchanges within 45 days of a quarter ending (Q4 gets 60 days, because it arrives together with the audited full-year numbers).
The filing itself is short — usually a few pages. The core of it is a condensed income statement: revenue at the top, costs in the middle, profit at the bottom, with the same quarter last year printed alongside for comparison. That side-by-side column is your best friend.
Where to find it
- Exchange websites: NSE and BSE publish every filing under the company’s “Corporate Announcements” or “Financial Results” section. This is the primary source.
- The company’s investor relations page: the same PDF, often with an easier-to-read investor presentation and press release next to it.
Prefer the exchange filing over news headlines. Headlines compress a ten-page document into six words, and the six words are often the least important part.
The five numbers to check, in order
- Revenue (often labelled “total income from operations”) — everything the company sold in the quarter. Is it higher than the same quarter last year?
- Operating profit — profit from the core business, before interest, tax and accounting charges like depreciation. Many companies report this as EBITDA. Did it grow faster or slower than revenue?
- Operating margin — operating profit divided by revenue. A margin that expands means the company kept more of every rupee it earned; a shrinking margin means costs are rising faster than sales.
- Net profit (called PAT, profit after tax) — what is left after every cost, interest payment and tax. This is the headline number — and the one most easily distorted by one-off items, as we will see below.
- EPS — earnings per share, the net profit divided across every share. It is the “E” in the P/E ratio, which is why analysts obsess over it.
A worked example with simple numbers
Imagine Sharma Snacks Ltd reports its Q2 results. The filing shows this quarter next to the same quarter last year:
- Revenue: ₹1,000 crore vs ₹800 crore last year — growth of 25%.
- Operating profit: ₹200 crore vs ₹144 crore — growth of about 39%, faster than revenue. Good sign.
- Operating margin: 200 ÷ 1,000 = 20%, up from 18% (144 ÷ 800) last year. The business kept 2 extra paise of every rupee sold.
- Net profit: ₹140 crore vs ₹80 crore — up 75%. Spectacular… until you read the notes.
- EPS: with 10 crore shares outstanding, EPS is ₹14 vs ₹8 last year.
The notes reveal that ₹50 crore of that profit came from selling an old warehouse — a one-time gain. Strip it out and the repeatable profit is ₹90 crore vs ₹80 crore: growth of about 13%, not 75%. Still a decent quarter — but a very different story from the headline.
Compare YoY, not just QoQ
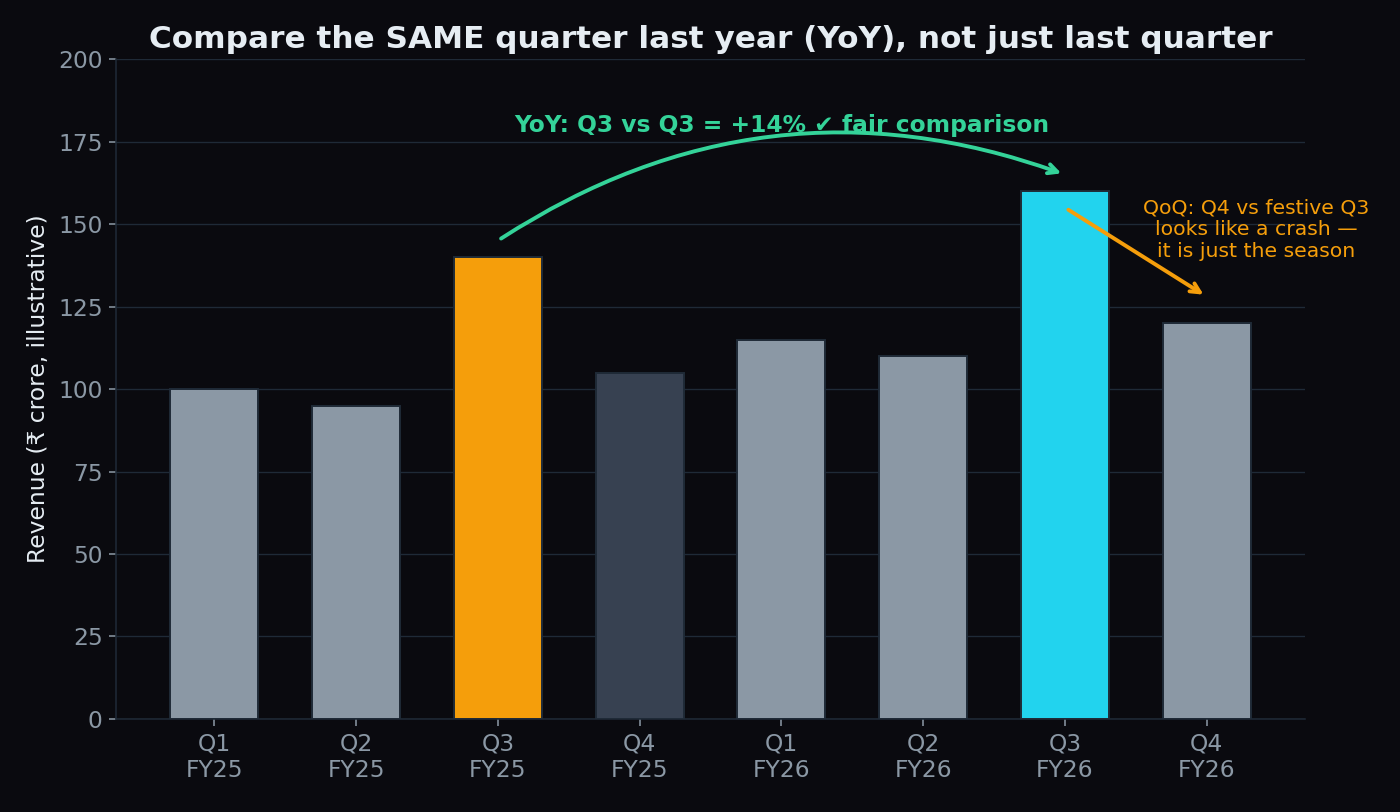
Two comparison habits matter:
- YoY (year-on-year): this quarter vs the same quarter last year. This is the fair comparison, because it matches season against season.
- QoQ (quarter-on-quarter): this quarter vs the immediately previous one. Useful for spotting a turn, but noisy.
Many Indian businesses are seasonal. A snacks or apparel company usually has its biggest quarter in October–December, thanks to festive demand. Compare the January–March quarter with that festive quarter and it will look like a collapse every single year — when nothing is wrong. That is why the YoY column comes printed in the filing itself.
Watch for one-off items
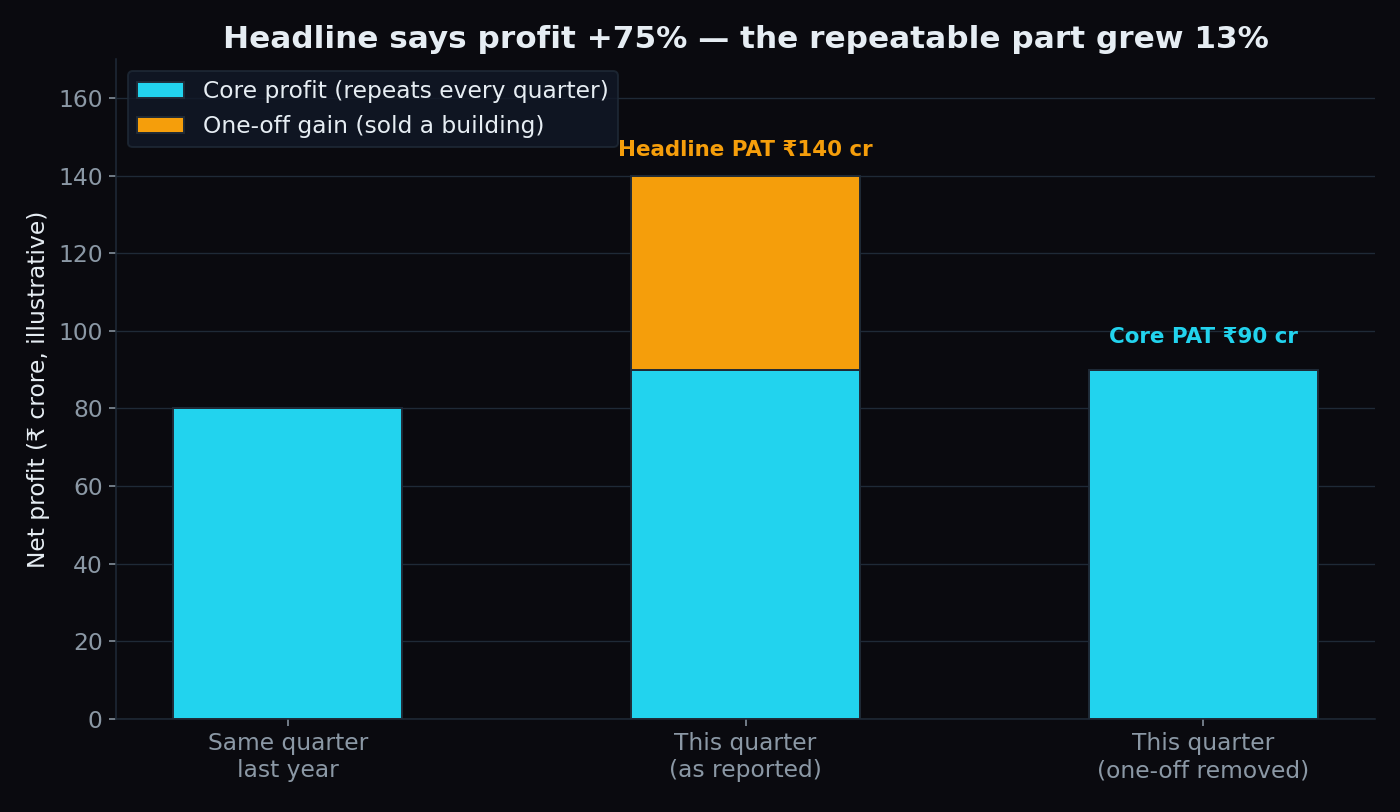
One-off items (the filing may call them “exceptional items”) are gains or losses that will not repeat: selling land or a business unit, a tax refund, a write-off, a legal settlement. They flow into net profit and can make a dull quarter look brilliant or a fine quarter look terrible.
The habit that protects you: read the notes below the results table before believing the headline profit number. The notes are usually a handful of numbered points and take two minutes.
Beyond the numbers: three quick checks
- Consolidated vs standalone: standalone results cover only the parent company; consolidated results include its subsidiaries. If a company has meaningful subsidiaries, the consolidated numbers describe the real business.
- Segment results: larger companies break revenue and profit down by business segment. One booming segment can hide another that is quietly shrinking.
- Management commentary: the press release and earnings call explain why the numbers moved and what management expects next. For the deeper, once-a-year version of this exercise, see our guide on how to read an annual report.
The honest catch: good results can still sink a stock
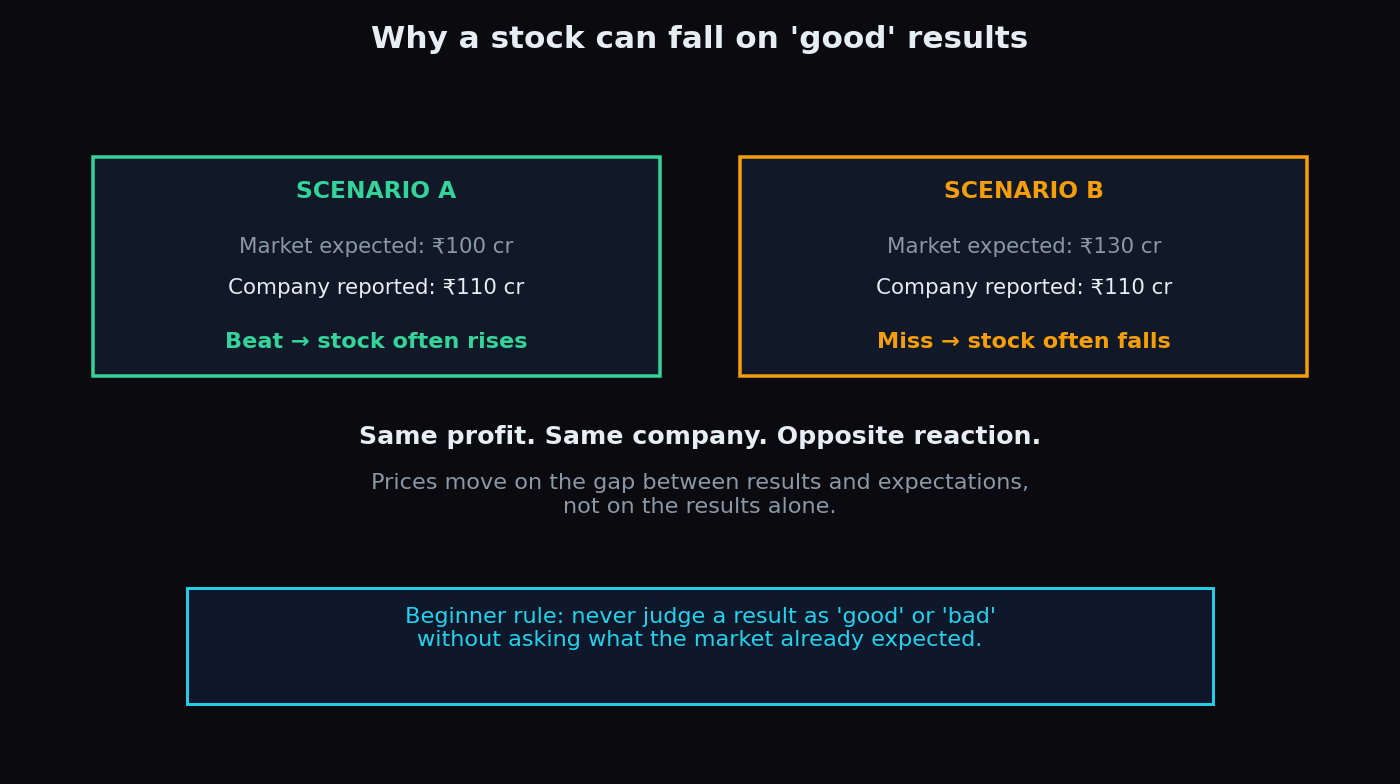
Here is the part that confuses every beginner at least once: a company reports record profit and the stock falls the same day. That is not the market being irrational. Share prices move on the gap between results and what investors already expected — not on the results alone. If everyone expected ₹130 crore and the company delivered ₹110 crore, the “record profit” is a disappointment. Expectations were already built into the price before the announcement.
Key takeaway: a results announcement is never “good” or “bad” on its own. It is good or bad relative to the same quarter last year (after removing one-offs) and relative to what the market expected. The five-number checklist handles the first part; humility about expectations handles the second.
The checklist, on one screen
- Open the exchange filing, not a headline.
- Check revenue growth YoY.
- Check operating profit and whether the margin expanded or shrank.
- Check net profit — then read the notes for one-off items.
- Check EPS against last year.
- Glance at segments and consolidated vs standalone.
- Remember: the price reaction depends on expectations, not just the numbers.
Results season moves the whole market, not just one stock. TrueTrend turns each day’s positioning across Nifty, Bank Nifty and F&O into a clear, at-a-glance read — and it scores its own track record in public. Create a free account and see the day’s structure for yourself.
See these concepts on live market data — free
Create a free TrueTrend account to watch daily support/resistance levels, market regime, and option-positioning charts on NIFTY, BankNifty and 12 more instruments. Every level we publish is scored on a public scoreboard — misses included. No card required.
Free forever tier · daily levels with published hit-rates across every instrument. Descriptive market structure, not investment advice.
Not ready for an account? Get the daily levels by email.
One short email each market day — the indices' call wall, put wall, gamma flip and max pain, and how the last session's levels scored. Free, no account, unsubscribe anytime.
Descriptive market structure, not investment advice. We never share your email.