Interest Coverage Ratio: Can a Company Pay Its Interest?
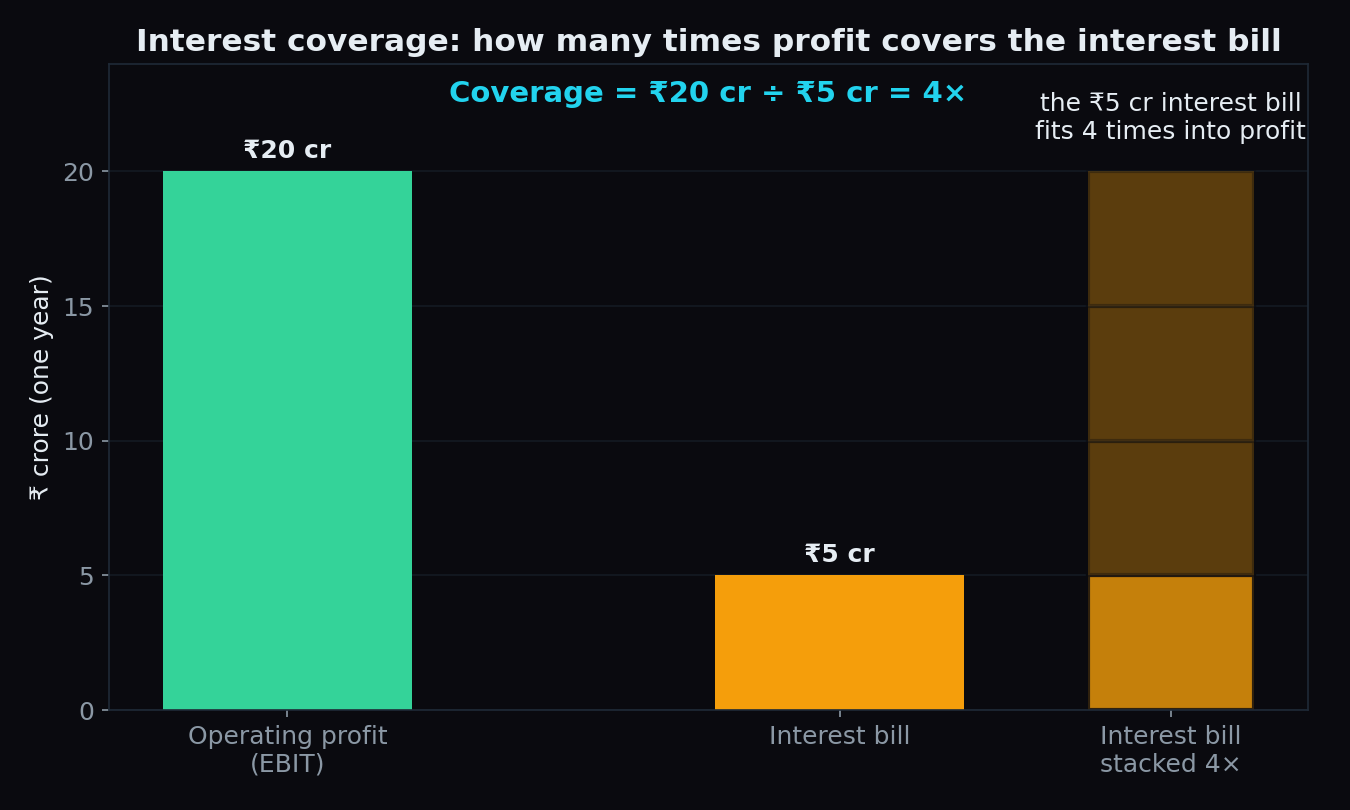
A company earns ₹20 crore of operating profit in a year and owes its lenders ₹5 crore of interest for the same year. Divide the first number by the second and you get 4. That single number — the interest coverage ratio — answers one of the most practical questions you can ask about any borrower: can this company actually pay its interest, and how much room does it have if business turns bad? This post explains the ratio with simple numbers, shows how analysts commonly read it, and lists the traps that make it lie.
Start with a household version
Imagine a person earning ₹1,00,000 a month. The interest portion of their loan payments comes to ₹25,000 a month. Their income covers the interest 4 times over (1,00,000 ÷ 25,000 = 4). Even if their income fell by half, they could still pay the interest and have money left for everything else. Now imagine a neighbour who earns the same ₹1,00,000 but owes ₹90,000 of interest a month. Their income covers interest just 1.1 times. One bad month — a salary cut, a medical bill — and they miss a payment.
The interest coverage ratio applies exactly this logic to a company. It measures the size of the cushion between what the business earns and what it must hand to lenders, no matter what.
The formula, in plain words
Interest coverage ratio = operating profit (EBIT) ÷ interest expense.
Two terms to define:
- EBIT stands for earnings before interest and tax — the profit the business generates from actually running its operations, before lenders and the taxman take their share. It is often close to the line called “operating profit” in a results statement. (A related measure, EBITDA, also adds back depreciation — we cover it in our EBITDA explainer.)
- Interest expense is the cost of the company’s borrowings for the period. In Indian results statements it usually appears as the line “finance costs”.
The answer is read as “times covered”. A ratio of 4 means the year’s operating profit could pay the year’s interest bill four times over. A ratio of 1 means profit exactly equals interest — nothing is left. Below 1, the business does not earn enough to pay its lenders from operations at all.
A worked example with round numbers
Take a furniture maker with one year of results:
- Revenue: ₹100 crore.
- All operating costs (wood, wages, rent, electricity, advertising): ₹80 crore.
- Operating profit (EBIT): ₹20 crore.
- Interest on loans (finance costs): ₹5 crore.
- Interest coverage ratio: 20 ÷ 5 = 4×.
The picture makes the idea physical: the ₹5 crore interest bill fits four times inside the ₹20 crore of operating profit. Profit could fall by half, and then fall by half again, and the company could still pay its lenders. That is what a cushion looks like.
How the number is commonly read
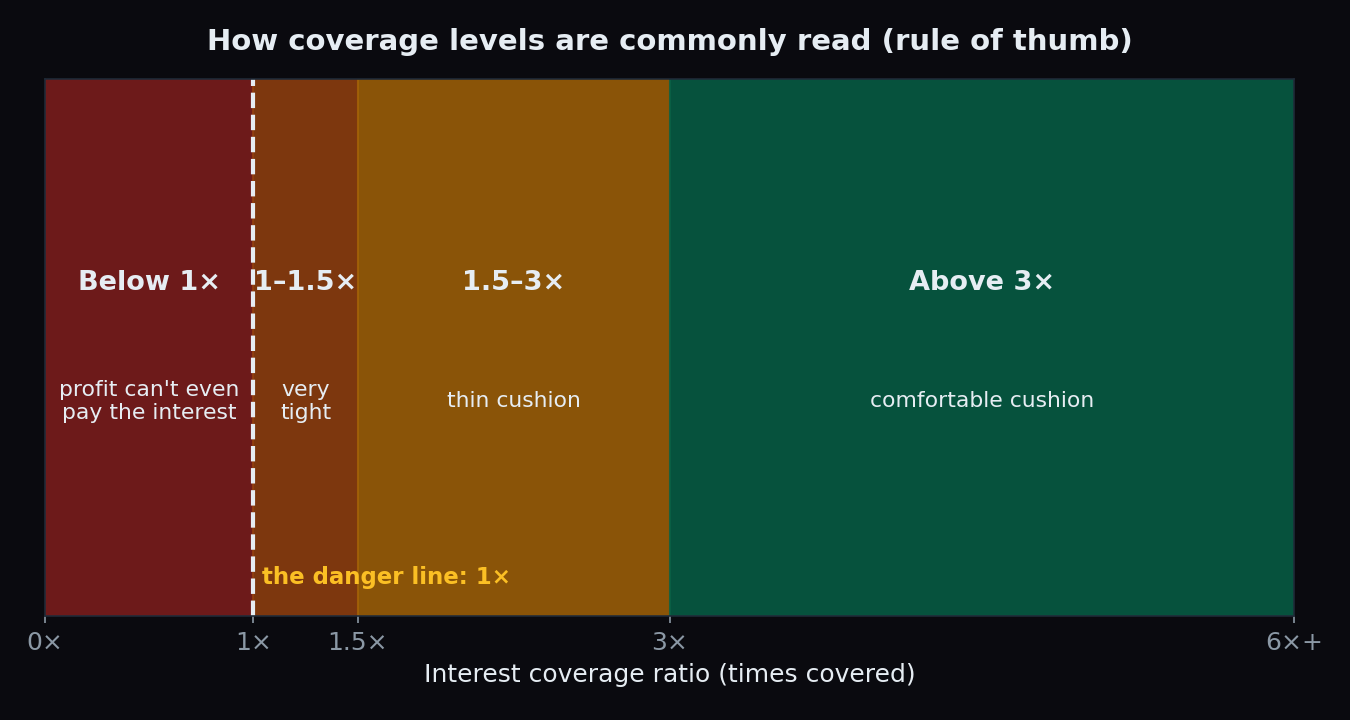
- Above 3×: generally read as a comfortable cushion — operations earn several times the interest bill.
- 1.5× to 3×: a thinner cushion. Fine in a good year; a sharp downturn starts to matter.
- 1× to 1.5×: very tight. Most of the operating profit already belongs to lenders.
- Below 1×: the danger zone. The business cannot pay its interest from what it earns, so it must borrow more, delay payments, or raise money some other way just to service old debt.
Treat these bands as a rough map, not a law. Capital-heavy businesses with steady cash flows (utilities, toll roads) routinely operate at lower coverage than, say, an IT services firm, because their revenue is more predictable. The comparison that means something is against the company’s own history and against rivals in the same industry.
The trend matters more than the level
A single year’s ratio is a snapshot. The more revealing habit is watching the direction over several years. A classic pattern before corporate trouble looks like this: operating profit stays roughly flat, while debt — and therefore the interest bill — keeps growing.
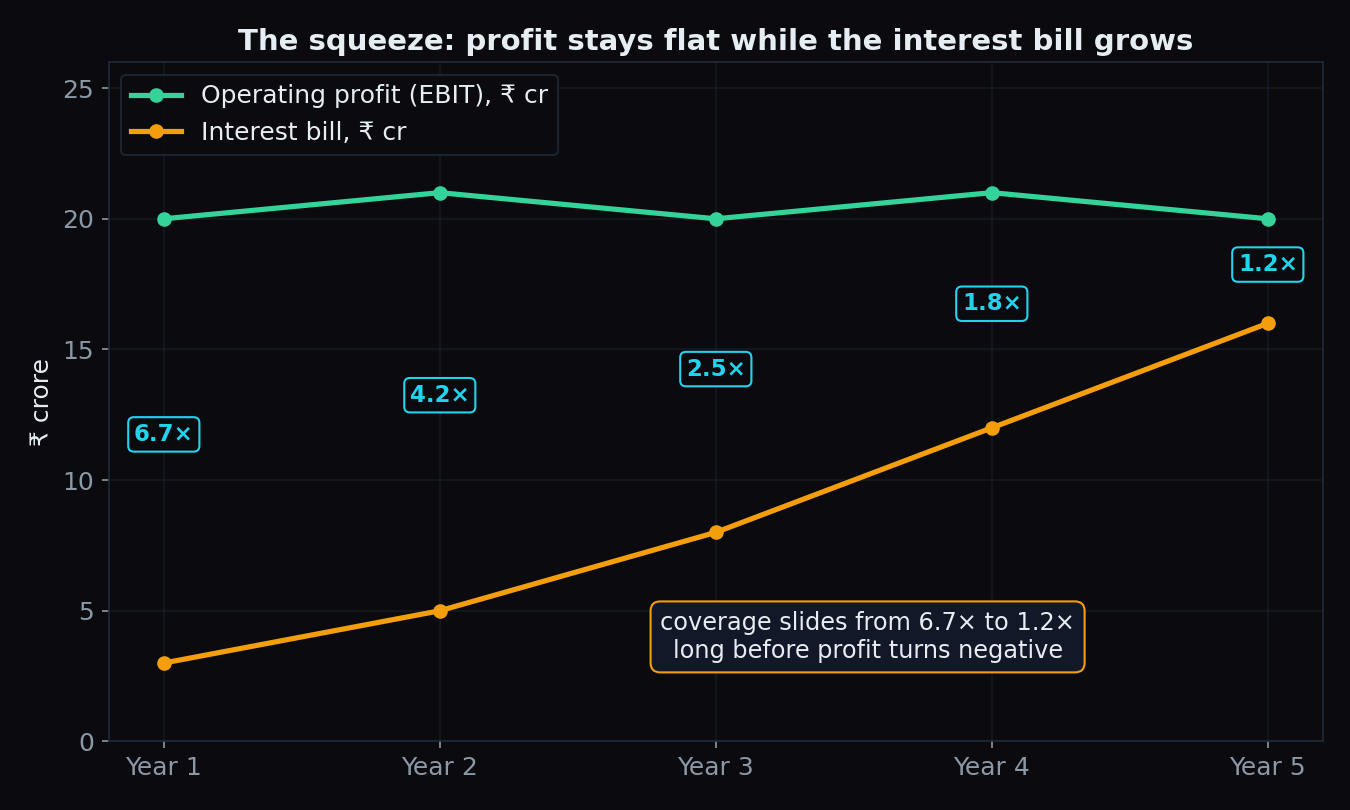
In this illustration the company never reports a loss. Profit holds near ₹20 crore for all five years. Yet coverage slides from 6.7× to 1.2× because the interest bill climbs from ₹3 crore to ₹16 crore. The profit line looks fine; the coverage line is quietly flashing. Several well-known Indian corporate collapses followed this shape — coverage deteriorated for years in the published accounts before the default made headlines.
Where to find the numbers
Everything you need sits in the profit-and-loss statement that every listed company publishes each quarter:
- Interest expense = the “finance costs” line.
- EBIT is rarely printed as its own line, but you can rebuild it: take profit before tax and add back finance costs. (Purists also remove “other income” — more on that below.)
Use the consolidated statements where available, so subsidiaries’ debt is included. If reading a results statement is new to you, start with our guide to the income statement. Coverage also pairs naturally with the debt-to-equity ratio: debt-to-equity shows how much a company has borrowed, while coverage shows whether it can afford the ongoing cost of those borrowings. Both belong to the toolkit of fundamental analysis.
The honest catch
- EBIT is accounting profit, not cash. A company can book profit on sales it has not yet collected while interest must be paid in real money. Coverage can look adequate while the bank account is empty.
- “Other income” can flatter the ratio. Interest earned on a cash pile or a one-off gain sits inside profit before tax. Strip one-offs out to see what the core business can really cover.
- Definitions vary. Some sources compute coverage with EBITDA instead of EBIT, which produces a rosier number because depreciation is added back. Before comparing two companies, check the same formula was used for both.
- Cyclical earnings flatter the peak. A steel or cement maker can show 8× coverage at the top of a cycle and slip below 2× in a downturn with the same debt. Look at coverage across a full cycle, not one great year.
- It does not apply to banks and NBFCs. For lenders, interest is the raw material of the business itself, so this ratio is meaningless for them — analysts use different measures there.
- Capitalised interest can hide costs. During big construction projects, some interest is added to the asset’s cost instead of the P&L, so the finance-costs line can understate what the company actually owes lenders each year.
Key takeaway: the interest coverage ratio is a cushion measure — how many times operating profit covers the interest bill. The level tells you how much room a company has today; the multi-year trend tells you whether that room is growing or quietly disappearing.
Ratios like this describe a single company’s health. The same discipline — measuring instead of guessing — applies to the market as a whole. TrueTrend turns Nifty and Bank Nifty positioning data into a clear, at-a-glance read and scores its own signals in public, so you can see what actually held up before you rely on it. You can create a free account and judge the track record yourself.
See these concepts on live market data — free
Create a free TrueTrend account to watch daily support/resistance levels, market regime, and option-positioning charts on NIFTY, BankNifty and 12 more instruments. Every level we publish is scored on a public scoreboard — misses included. No card required.
Free forever tier · daily levels with published hit-rates across every instrument. Descriptive market structure, not investment advice.
Not ready for an account? Get the daily levels by email.
One short email each market day — the indices' call wall, put wall, gamma flip and max pain, and how the last session's levels scored. Free, no account, unsubscribe anytime.
Descriptive market structure, not investment advice. We never share your email.