Intraday vs Delivery Trading: Costs, Margins and Mindset
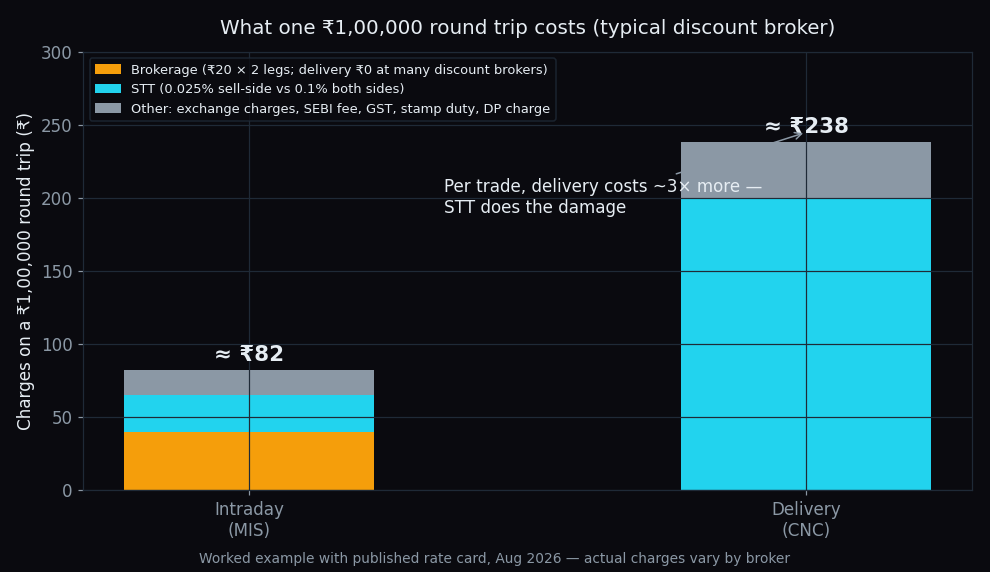
On the same ₹1,00,000 trade with a typical discount broker, an intraday round trip costs about ₹82 in charges, while a delivery round trip costs about ₹238 — roughly three times more. And yet it is intraday traders who usually end up paying far more over a year. This post unpacks that puzzle by comparing the two styles on the three things that actually differ: costs, margins and mindset.
First, what the two words mean
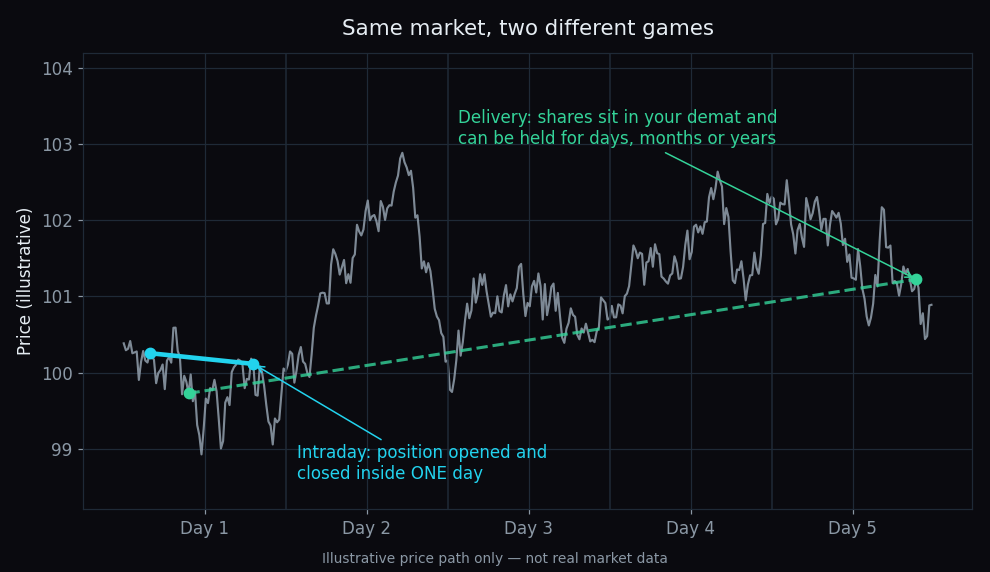
Intraday trading means opening and closing a position inside the same trading session. Shares bought at 10:15 am are sold back before the 3:30 pm close — and if the trader forgets, the broker automatically closes (“squares off”) the position. Nothing is held overnight. Brokers label these orders MIS (Margin Intraday Square-off).
Delivery trading means the shares are actually transferred — “delivered” — into your demat account, the electronic locker where your shares are stored. Once there, they can be held for days, months or decades. Brokers label these orders CNC (Cash and Carry).
Everything below is about the equity cash segment — ordinary shares. Futures and options run on a separate margin system with rules of their own.
An everyday analogy: renting vs owning
Intraday is like renting a car for the day. The rental fee is small, you use the car for a few hours, and it goes back to the garage by evening — you never own it. Delivery is buying the car: the upfront paperwork and registration cost more, but the car is yours for as long as you keep it. Here is the catch most people miss: rent a car every single day for a year, and the rental bills can quietly overtake the price of the car. Trading costs work exactly the same way.
The cost sheet, side by side
Take one worked example: a ₹1,00,000 position, bought and later sold (a “round trip”), at a typical discount broker on the NSE. Rates below are the published rate card as of August 2026 — brokers differ, so treat the exact rupee figures as illustrative and check your own contract note.
- Brokerage — the broker’s own fee. Discount brokers typically charge up to ₹20 per executed intraday order, so a round trip is about ₹40. Many of the same brokers charge ₹0 brokerage on equity delivery.
- STT (Securities Transaction Tax) — a government tax collected on every trade. Intraday equity pays 0.025% on the sell side only (₹25 in our example). Delivery pays 0.1% on both the buy and the sell (₹100 + ₹100 = ₹200). This single line is why delivery looks expensive per trade.
- Stamp duty — charged on the buy side: 0.003% for intraday (₹3) vs 0.015% for delivery (₹15).
- Exchange transaction charges and the SEBI turnover fee — small percentage charges from the exchange and the regulator, roughly ₹6 combined on this trade for either style, plus 18% GST on brokerage and those charges.
- DP (depository participant) charge — delivery only: a flat fee of roughly ₹15–16 per stock for each day you sell shares out of your demat account.
Add it up and the intraday round trip costs about ₹82, while the delivery round trip costs about ₹238.
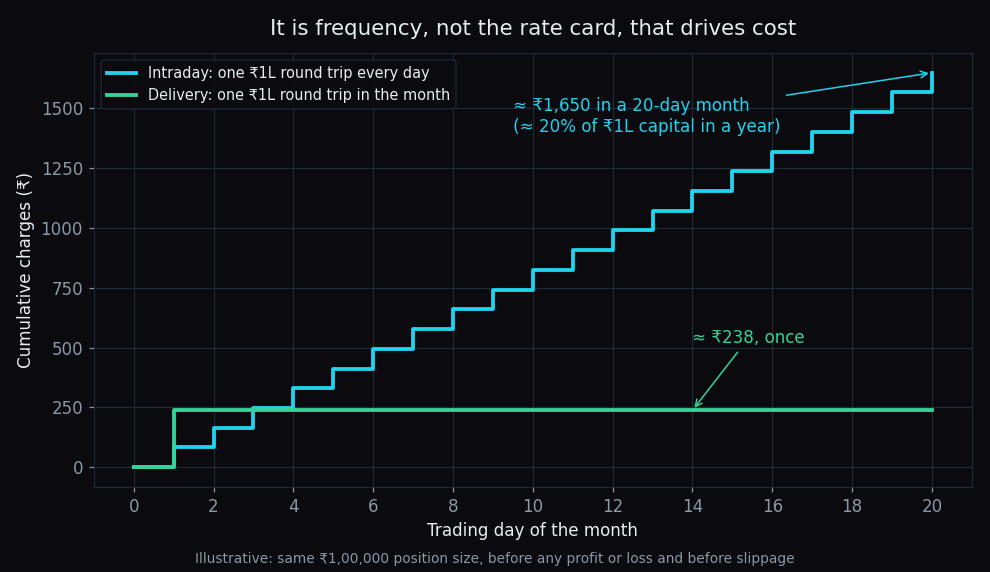
So delivery loses on the rate card. But now bring in frequency. ₹82 is about 0.08% of the position — the price must move that much in your favour just to break even, every single trade. An intraday trader running one such round trip every trading day pays roughly ₹1,650 in a 20-day month, close to ₹20,000 in a year — around 20% of that ₹1 lakh capital, before earning a rupee and before slippage (the small gap between the price you expect and the price you actually get). The delivery trader who took one position and held it paid ₹238, once.
For a line-by-line breakdown of every charge on a contract note, see the real cost of one trade.
Margins: how much money each style needs
Margin is the deposit your broker requires before you can take a position. For delivery, the rule is simple: you pay the full amount. ₹20,000 in the account gets you ₹20,000 of shares.
For intraday, brokers require only a fraction of the trade value, because the position must be closed the same day. Under SEBI’s peak-margin rules, the minimum margin for equity intraday is 20% of the trade value — leverage of at most about 5× — and for volatile stocks brokers demand more. So the same ₹20,000 can control up to a ₹1,00,000 intraday position.
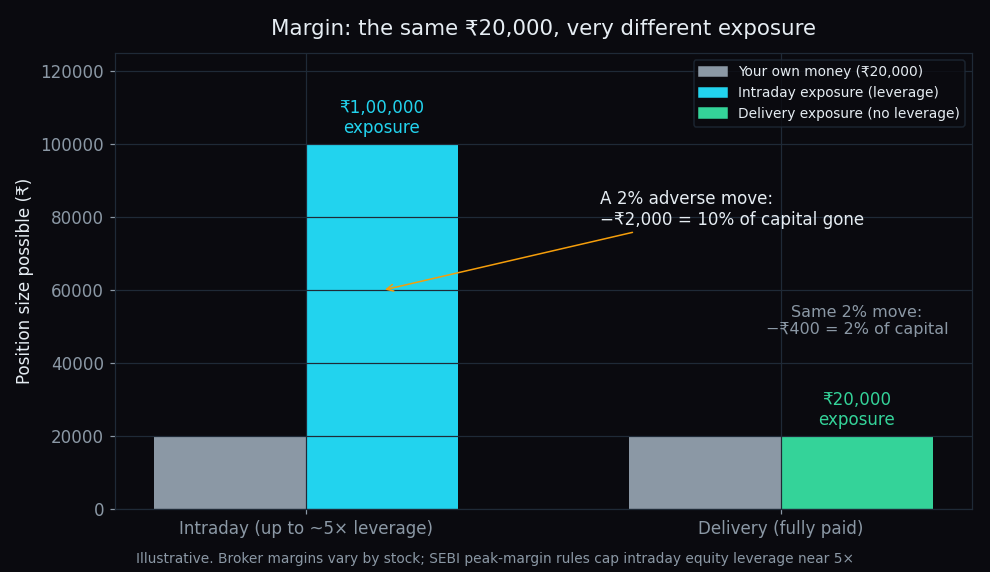
That sounds like a gift until you run the numbers both ways. A 2% favourable move on the ₹1,00,000 intraday position earns ₹2,000 — 10% of the capital in a day. The same 2% move against the position loses ₹2,000 — also 10% of the capital, in a day. Leverage multiplies both directions with perfect fairness. The delivery trader with ₹20,000 of fully paid shares gains or loses ₹400 on the same move, and can simply keep holding. (Some brokers also lend money for delivery positions through a Margin Trading Facility — that is a loan with interest, not free leverage.) The mechanics are covered in margin and leverage explained.
Taxes are different too
Intraday profits are treated as speculative business income and taxed at your income-tax slab rate. Delivery gains are capital gains: as of FY 2025–26, shares sold within 12 months attract short-term capital gains tax of 20%, while shares held longer attract long-term capital gains tax of 12.5% on gains above the ₹1.25 lakh annual exemption. Tax rules change with budgets and depend on your situation — confirm the current rates with a tax professional before filing.
The mindset gap
The costs and margins are arithmetic. The bigger difference is what each style demands from the person.
- Time. Intraday is a job: the position needs watching from entry until square-off. Delivery can be reviewed in the evening, after the market is closed and emotions are quieter.
- Decisions. An intraday trader may make dozens of decisions a day, each under time pressure, each paying the cost sheet above. A delivery investor might make a handful a month.
- Losses. Because intraday positions are leveraged and forcibly closed by 3:30 pm, losses are realised the same day — there is no “waiting for it to come back”. That makes a pre-decided exit point essential; see what a stop-loss is. A delivery investor can sit through a drawdown — which is sometimes patience and sometimes denial.
The record on how this plays out is public. SEBI’s July 2023 study of individual traders in the equity cash segment found that about 7 out of 10 individual intraday traders (71%) made a net loss in FY 2022–23, and that the most frequent traders lost even more often — consistent with the frequency-cost math above. The picture in derivatives is harsher still; see SEBI’s 9-out-of-10 F&O study.
The honest takeaway: the per-trade rate card flatters intraday and penalises delivery. Frequency and leverage reverse that verdict for most people. Whichever style you study, price in the full bill — charges, slippage, taxes and your own temperament — not just the brokerage line.
So which one is better?
Neither, in the abstract. They are different games played on the same field: one compresses risk, cost and decision-making into hours and demands leverage discipline; the other spreads them over months and demands patience through drawdowns. What separates people who last from people who quit is rarely the style they picked — it is whether they understood the full cost sheet, the real exposure their margin created, and their own reaction to a losing day before the market taught them.
Whichever game you study, see the field clearly first. TrueTrend turns option positioning, market regime and key levels for Nifty, Bank Nifty and F&O stocks into one clear, at-a-glance read — and it scores its own track record in public on the scoreboard. Create a free account to explore it.
See these concepts on live market data — free
Create a free TrueTrend account to watch daily support/resistance levels, market regime, and option-positioning charts on NIFTY, BankNifty and 12 more instruments. Every level we publish is scored on a public scoreboard — misses included. No card required.
Free forever tier · daily levels with published hit-rates across every instrument. Descriptive market structure, not investment advice.
Not ready for an account? Get the daily levels by email.
One short email each market day — the indices' call wall, put wall, gamma flip and max pain, and how the last session's levels scored. Free, no account, unsubscribe anytime.
Descriptive market structure, not investment advice. We never share your email.