IV Rank vs IV Percentile: Is Volatility Cheap or Expensive?
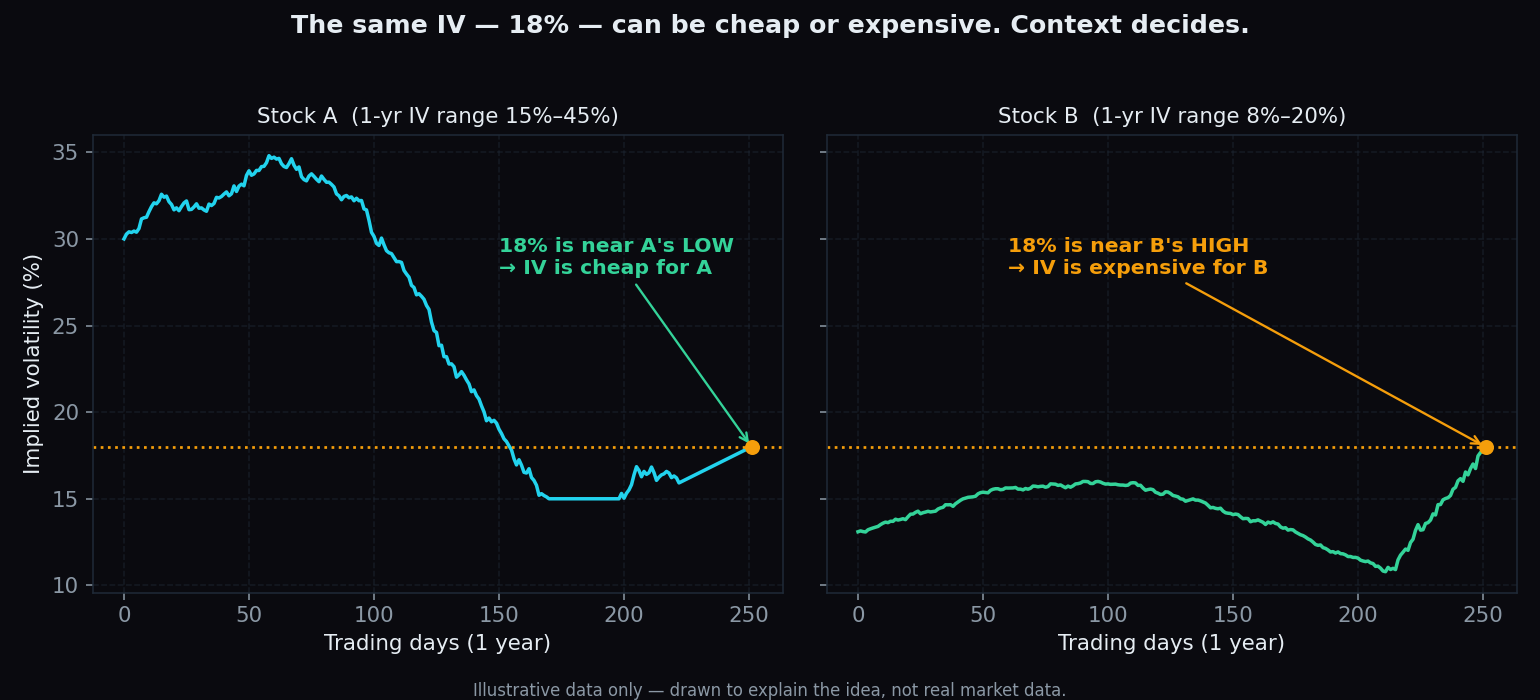
Suppose Nifty options show an implied volatility of 18%. Is that a lot? Here is the honest answer: the number alone cannot tell you. The same 18% can be unusually calm for one market and unusually stormy for another. Traders solve this with two small context scores — IV rank and IV percentile — and this post explains both with simple round numbers, including the one situation where the two strongly disagree.
A 30-second refresher: what implied volatility is
Implied volatility (IV) is the market's estimate of how much an index or stock might move in the near future. It is not measured from past price swings; it is worked backwards from what people are currently paying for options. When option premiums rise, the implied move is bigger, so IV is higher. When premiums shrink, IV is lower. If IV is new to you, start with our explainer on what implied volatility really measures, then come back — this post is about judging whether an IV reading is high or low.
The problem: an IV number without context
Think of a price tag. A shirt costs ₹900. Is that expensive? You cannot say until you know what that shirt usually costs. If it normally swings between ₹800 and ₹2,000, then ₹900 is a bargain. If it normally sits between ₹400 and ₹950, the same ₹900 is close to the most anyone has ever paid. The number on the tag did not change — the context did.
IV works exactly the same way. An option market that has spent the past year between 15% and 45% IV is very quiet at 18%. Another market that has spent the year between 8% and 20% is near its most nervous at that same 18%.
IV rank and IV percentile are just two different ways of writing that context down as a single score from 0 to 100.
IV rank: where today sits in the one-year range
IV rank answers one question: between the lowest and highest IV of the past year, how far up does today's reading sit?
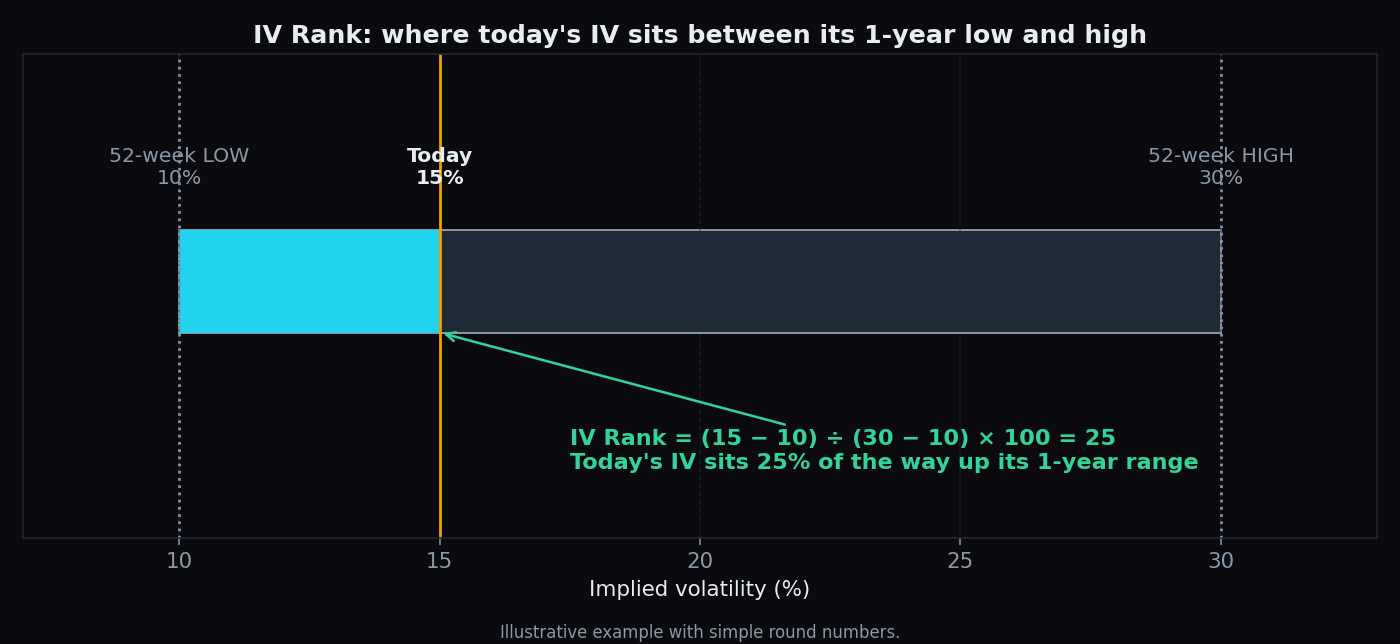
The formula: IV rank = (today's IV − 52-week low) ÷ (52-week high − 52-week low) × 100.
A worked example with simple numbers. Over the past year, suppose an index's IV bottomed at 10% and peaked at 30%. Today it reads 15%.
- Today minus the low: 15 − 10 = 5
- The full range: 30 − 10 = 20
- IV rank: 5 ÷ 20 × 100 = 25
So today's IV sits a quarter of the way up its one-year range. A rank near 0 means IV is at the bottom of its range; a rank near 100 means it is at the top. As a rough shorthand, many traders treat readings above 50 as elevated and readings below 20 as subdued — relative to that market's own year, not to any universal standard.
IV percentile: how many days were calmer than today
IV percentile asks a slightly different question: out of all the trading days in the past year, on what fraction of them was IV lower than it is today?
Another worked example. A year has roughly 250 trading days. Suppose IV closed below today's level on 200 of them. IV percentile = 200 ÷ 250 × 100 = 80. In plain words: four out of five days in the past year were calmer than today. That is genuinely elevated, whatever the extremes were.
Notice the difference in what each score looks at. Rank only cares about two days — the highest and the lowest of the year. Percentile counts every single day.
Why the two can disagree — and when it matters
Most of the time the two scores tell a similar story. They split apart after one thing: a short, violent spike.
Say a market spent almost the whole year with IV between 10% and 22%. Then one event week — an election result, a budget announcement, a global shock — briefly sent IV to 60% before it collapsed back within days. Today IV reads 18%. Now score it both ways:
- IV rank = (18 − 10) ÷ (60 − 10) × 100 = 16. Looks sleepy.
- IV percentile ≈ 97, because IV was below 18% on roughly 97% of the year's days. Looks clearly elevated.
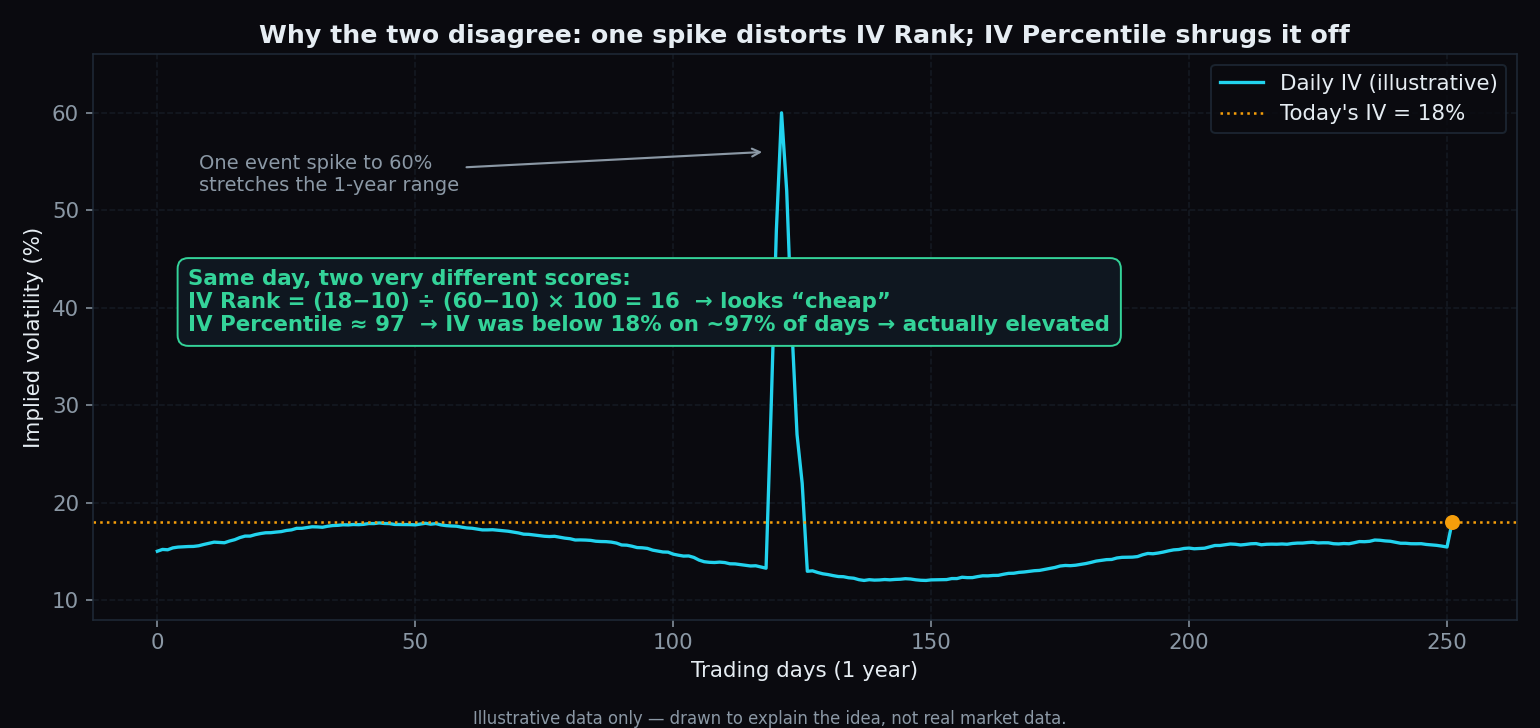
Both scores are arithmetically correct. The rank is low only because a single extreme week stretched the yardstick. The percentile ignores how extreme the spike was and simply counts days, so one outlier barely moves it.
Key takeaway: IV rank compares today to the year's two extremes; IV percentile counts how many days were calmer. After a big volatility spike, rank gets distorted for months — check both, and lean on percentile before calling volatility cheap or expensive.
How traders read high and low readings
These scores describe the environment; they do not predict anything. When both rank and percentile are high, option premiums are rich compared with that market's own recent history — time value is costly, and any calming of nerves can deflate it quickly. That deflation around scheduled events is the classic IV crush. When both are low, options carry less time-value cost, but the market is also implying smaller moves — the expected move priced into the chain shrinks with IV.
Either way, the score is a description of positioning and pricing, not an instruction. Rich premiums often exist precisely because real event risk is on the calendar; lean premiums often persist for months in trending markets.
The honest catch
- High can go higher. A percentile of 97 does not cap anything. In March 2020, India VIX — the IV gauge for Nifty options — spiked above 80, blowing through every reading that had looked "extreme" the week before.
- Both scores look backwards. They summarise the past year of IV. They say nothing about direction, and nothing about whether tomorrow's news justifies today's pricing.
- Regimes reset the yardstick. If a market shifts from a calm year to a turbulent one, rank and percentile will call the new normal "expensive" for months simply because the lookback window is stale.
- Compare like with like. India VIX tracks Nifty option IV; every stock has its own IV history with its own range. An IV rank of 60 on one underlying is not comparable to 60 on another — each score only makes sense against that market's own past.
TrueTrend turns this kind of context into a clear, at-a-glance read — positioning, volatility backdrop, and option-chain structure across Nifty, Bank Nifty and F&O stocks — and scores its own track record in public. Create a free account to see today's picture.
See these concepts on live market data — free
Create a free TrueTrend account to watch daily support/resistance levels, market regime, and option-positioning charts on NIFTY, BankNifty and 12 more instruments. Every level we publish is scored on a public scoreboard — misses included. No card required.
Free forever tier · daily levels with published hit-rates across every instrument. Descriptive market structure, not investment advice.
Not ready for an account? Get the daily levels by email.
One short email each market day — the indices' call wall, put wall, gamma flip and max pain, and how the last session's levels scored. Free, no account, unsubscribe anytime.
Descriptive market structure, not investment advice. We never share your email.