Overtrading: How to Catch the Silent Account Killer
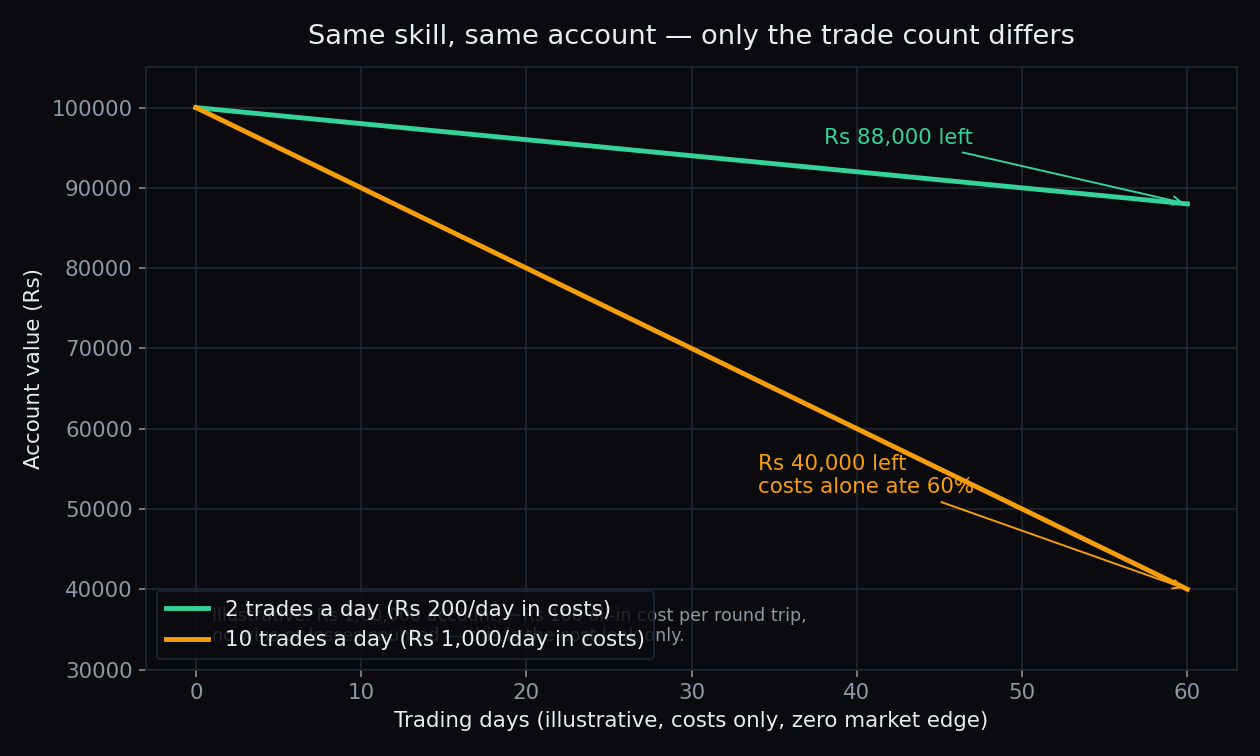
Ten trades a day feels like effort paying off. The maths says otherwise. On a Rs 1,00,000 account, at roughly Rs 100 of costs per completed trade, ten trades a day quietly removes about Rs 20,000 a month — a fifth of the account — before a single market view turns out right or wrong. That slow leak has a name: overtrading. This post explains what it is, shows the simple numbers behind it, and lists the early warning signs that let you catch it before the damage compounds.
What overtrading actually means
Overtrading is taking far more trades than your plan — or your evidence — can justify. It is not about one bad trade. It is a pattern: trading out of boredom, trading to recover a loss, trading because the screen is open and doing nothing feels wasteful.
A useful analogy is a toll bridge. Every time you cross, you pay a toll — whether the crossing was necessary or not. In trading, every completed trade (a round trip: one entry plus one exit) pays a toll made of brokerage, taxes, exchange charges and slippage — the small gap between the price you expect and the price you actually get. Cross the bridge twice a day and the tolls are a rounding error. Cross it twenty times a day and the tolls become your biggest expense.
We added up the full toll in what one trade really costs: on a Rs 1,00,000 intraday position, the charges alone come to roughly Rs 82 even if the price never moves. Add a little slippage and Rs 100 per round trip is a fair, simple estimate.
The toll-booth maths
Keep the numbers round. Two traders start with Rs 1,00,000 each, and assume — just for this example — that their wins and losses on price exactly cancel out. Zero edge, zero mistakes. The only difference is how often they trade.
- Trader A takes 2 trades a day. At Rs 100 each, that is Rs 200 a day — about Rs 4,000 over a 20-day trading month, or 4% of the account.
- Trader B takes 10 trades a day. That is Rs 1,000 a day — about Rs 20,000 a month, or 20% of the account.
Trader B now needs to earn 20% every single month on price moves alone just to stand still. Very few professionals earn that consistently. This is one reason SEBI's own research found that roughly 9 out of 10 individual F&O traders lose money — transaction costs pile on top of losses, and the most active traders pay the most.
The chart above is illustrative — drawn with synthetic numbers, no real market data — but the mechanism is exactly how real accounts bleed: not in one dramatic loss, but Rs 100 at a time.
Why it happens: three common triggers
- Revenge trading. After a loss, the urge to win it back immediately. The next trade is bigger, faster and less planned than the last one.
- Boredom. The market is quiet, the setup from your plan is not there, but the screen is open and a small "just in case" position feels harmless.
- Overconfidence after a streak. Three good trades in a row, and suddenly every wiggle on the chart looks like an opportunity.
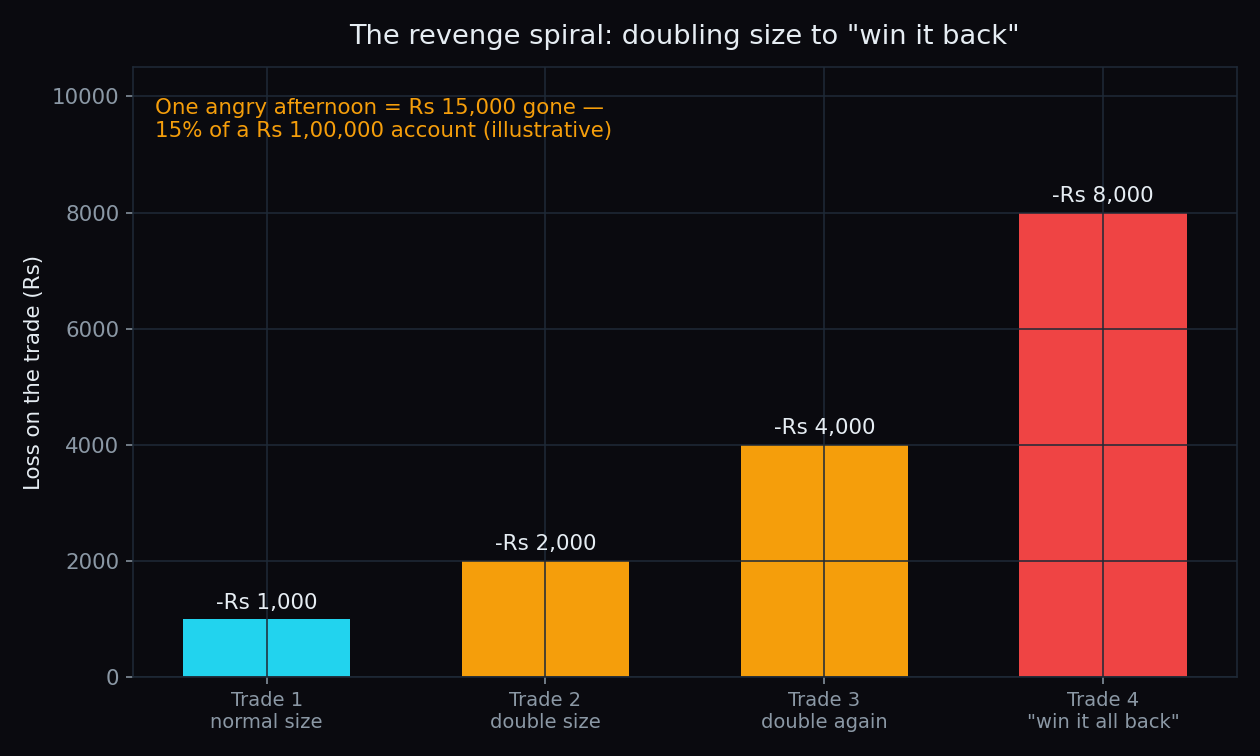
Revenge trading is the most expensive of the three because it combines more trades with bigger size. A simple illustration: a trader loses Rs 1,000 on a normal-sized trade, doubles the size to recover it, loses Rs 2,000, doubles again, and again. Four angry trades later, Rs 15,000 is gone — 15% of a Rs 1,00,000 account — in one afternoon.
Six early warning signs
- You cannot state, in one sentence, why you entered your last trade.
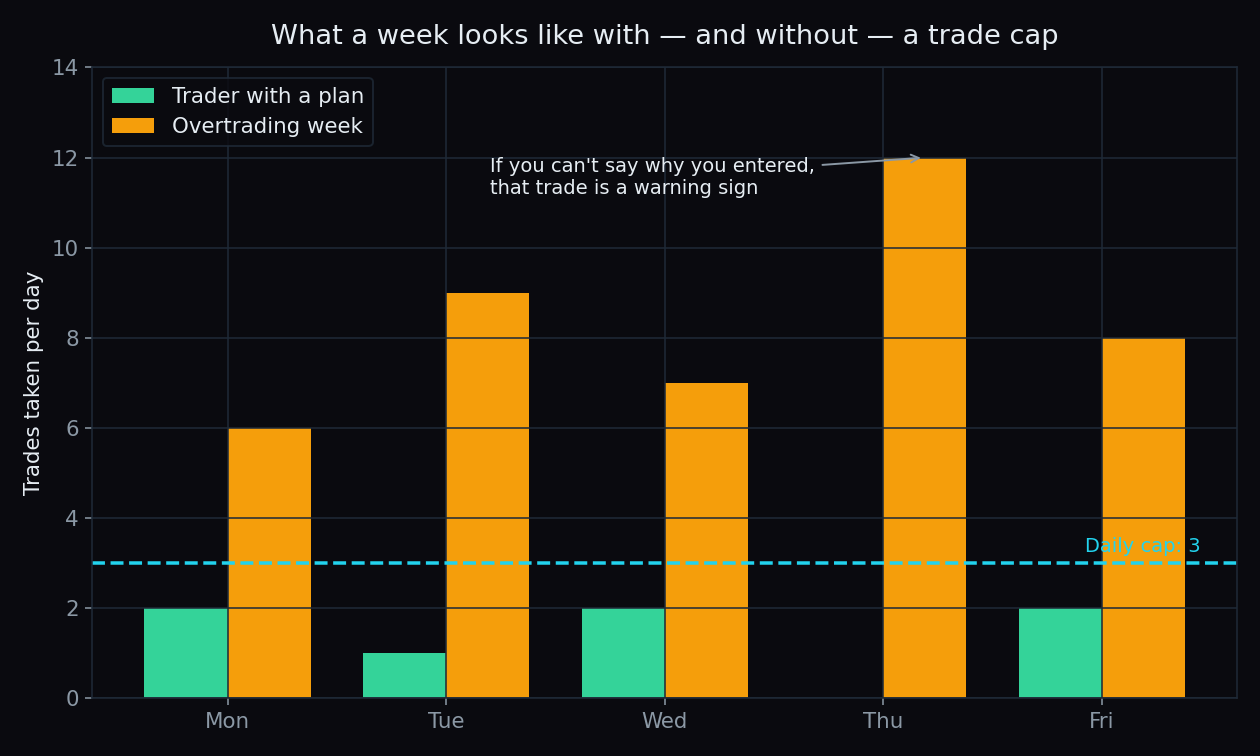
- Your trade count jumps on losing days. This is the single most reliable early signal — it shows the loss is driving the activity, not the setup.
- Your position size grows right after a loss instead of shrinking.
- You are in the market almost every minute the exchange is open, from the opening bell to the close.
- Your monthly charges are larger than your best winning trade.
- You feel relief, not calm, when the market closes.
How traders catch it early
The traders who escape this trap measure it instead of relying on willpower. Four habits show up again and again:
- A trading journal. A simple log of every trade: the reason for entry, the size, the result, and how you felt. Overtrading hides in memory but is obvious on paper — ten entries on a losing Tuesday jump off the page.
- A hard daily cap. A fixed maximum number of trades per day, decided before the session, not during it. When the cap is hit, the session is over. The number matters less than the fact that it exists.
- A monthly cost ledger. Adding up the total charges from contract notes once a month. Seeing "Rs 18,400" in one place changes behaviour faster than any lecture.
- A cool-down rule. After two losses in a row, a mandatory break — an hour, or the rest of the day. It interrupts the revenge spiral at the cheapest possible point: before trade three.
These habits work best alongside the basics of risk control — sensible position sizing and a pre-decided exit level for every trade — so that no single trade, however impulsive, can do serious damage.
The honest catch
Trading less does not create an edge. If a trader has no advantage in the market, two trades a day will lose money more slowly than ten — but it will still lose. Cutting frequency stops the leak; it does not fill the bucket. The real value of catching overtrading early is different: it keeps the account alive and the mind clear long enough to find out, honestly, whether an edge exists at all.
Overtrading rarely announces itself. It looks like effort, feels like commitment, and shows up in the account statement as a hundred small tolls. The earliest warning sign is not on any chart — it is a trade you cannot explain in one sentence.
The first step out of overtrading is seeing your own pattern clearly — and trading the structure in front of you, not the boredom inside you. TrueTrend turns Nifty and Bank Nifty positioning into a clear, at-a-glance read, and scores its own track record in public, so every trade you take starts from evidence. Create a free account to see it.
See these concepts on live market data — free
Create a free TrueTrend account to watch daily support/resistance levels, market regime, and option-positioning charts on NIFTY, BankNifty and 12 more instruments. Every level we publish is scored on a public scoreboard — misses included. No card required.
Free forever tier · daily levels with published hit-rates across every instrument. Descriptive market structure, not investment advice.
Not ready for an account? Get the daily levels by email.
One short email each market day — the indices' call wall, put wall, gamma flip and max pain, and how the last session's levels scored. Free, no account, unsubscribe anytime.
Descriptive market structure, not investment advice. We never share your email.