Promoter Holding and Share Pledging: Red Flags to Check
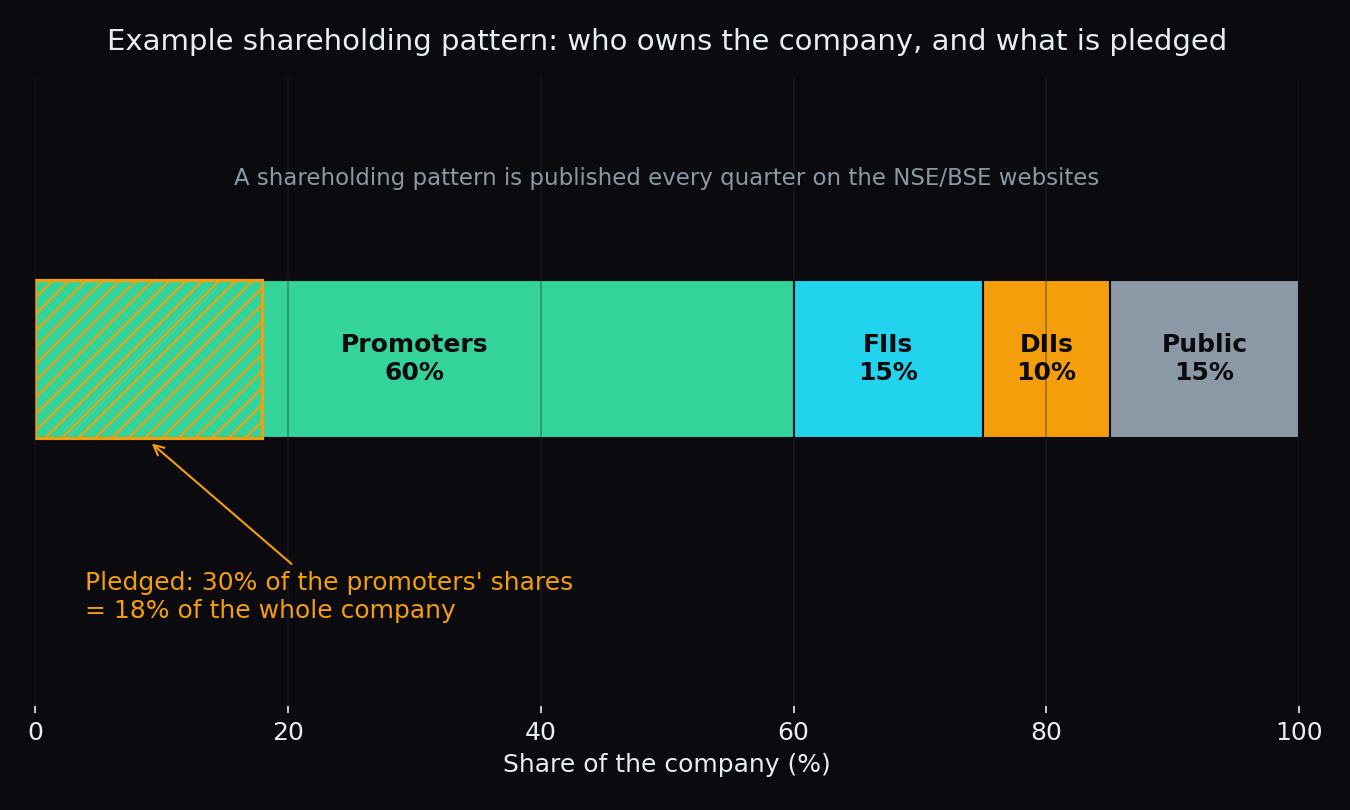
Open the shareholding page of any listed Indian company and one line deserves more attention than all the others: how much of the company its promoters own, and how much of that stake is pledged as loan collateral. Say promoters own 60% of a company and have pledged half of it. That single fact changes how the stock can behave in a bad week — and it is public information, updated every quarter. This post explains both terms with simple numbers, and the red flags worth checking before you study anything else.
Three terms to define first
- Promoter — the person, family or parent company that founded or controls the business. In India, listed companies must classify their owners as "promoter" or "public", so this is a formal label in the filings, not a vague one.
- Promoter holding — the percentage of all the company's shares that the promoters own. If a company has 10 crore shares and the promoters own 6 crore, the promoter holding is 60%.
- Share pledging — the promoters handing over some of their shares to a lender as collateral (security) for a loan. They still own the pledged shares and keep the dividends — but if the loan goes bad, the lender can seize and sell those shares.
One reading habit matters here: pledge numbers are usually reported as a percentage of the promoters' shares, not of the whole company. In the picture above, "30% pledged" means 30% of the promoters' 60% stake — which is 18% of the entire company. Always check which of the two a screener is showing you.
Why promoter holding matters: skin in the game
Think of a restaurant where the head chef eats their own cooking every day. You would trust that kitchen a little more. Promoter holding is the same idea — called skin in the game. When the people running the company keep most of their own wealth in its shares, their interests and yours point in roughly the same direction. When they quietly reduce their stake quarter after quarter, it is fair to ask what they know that outsiders do not.
That is why analysts doing fundamental analysis track the trend of promoter holding, not just the level. A stable or rising stake is unremarkable. A stake that falls for several consecutive quarters — especially without a clear stated reason such as a regulatory requirement to reduce it — is a prompt to dig deeper.
What pledging actually is: a worked example
Pledging is simply a loan against shares, the way gold loans are loans against gold. Round numbers make the mechanics clear:
- A company has 10 crore shares trading at ₹100 each, so its market capitalisation is ₹1,000 crore.
- Promoters own 6 crore shares (60% of the company), worth ₹600 crore.
- They pledge 3 crore shares — collateral worth ₹300 crore — and a lender advances them a ₹150 crore loan against it. Lenders typically lend only a fraction of the collateral's value; the gap is their safety cushion.
So far, nothing sinister. The trouble is that this collateral has a live price on a screen. Now let the share price fall from ₹100 to ₹60. The pledged shares are suddenly worth ₹180 crore against a ₹150 crore loan — the lender's cushion has almost vanished. The lender makes a margin call: "top up with more shares or cash, or we sell the collateral." If the promoters cannot top up, the lender invokes the pledge and sells the shares in the open market.
The pledge spiral
That forced selling is what makes heavy pledging dangerous. It creates a loop:
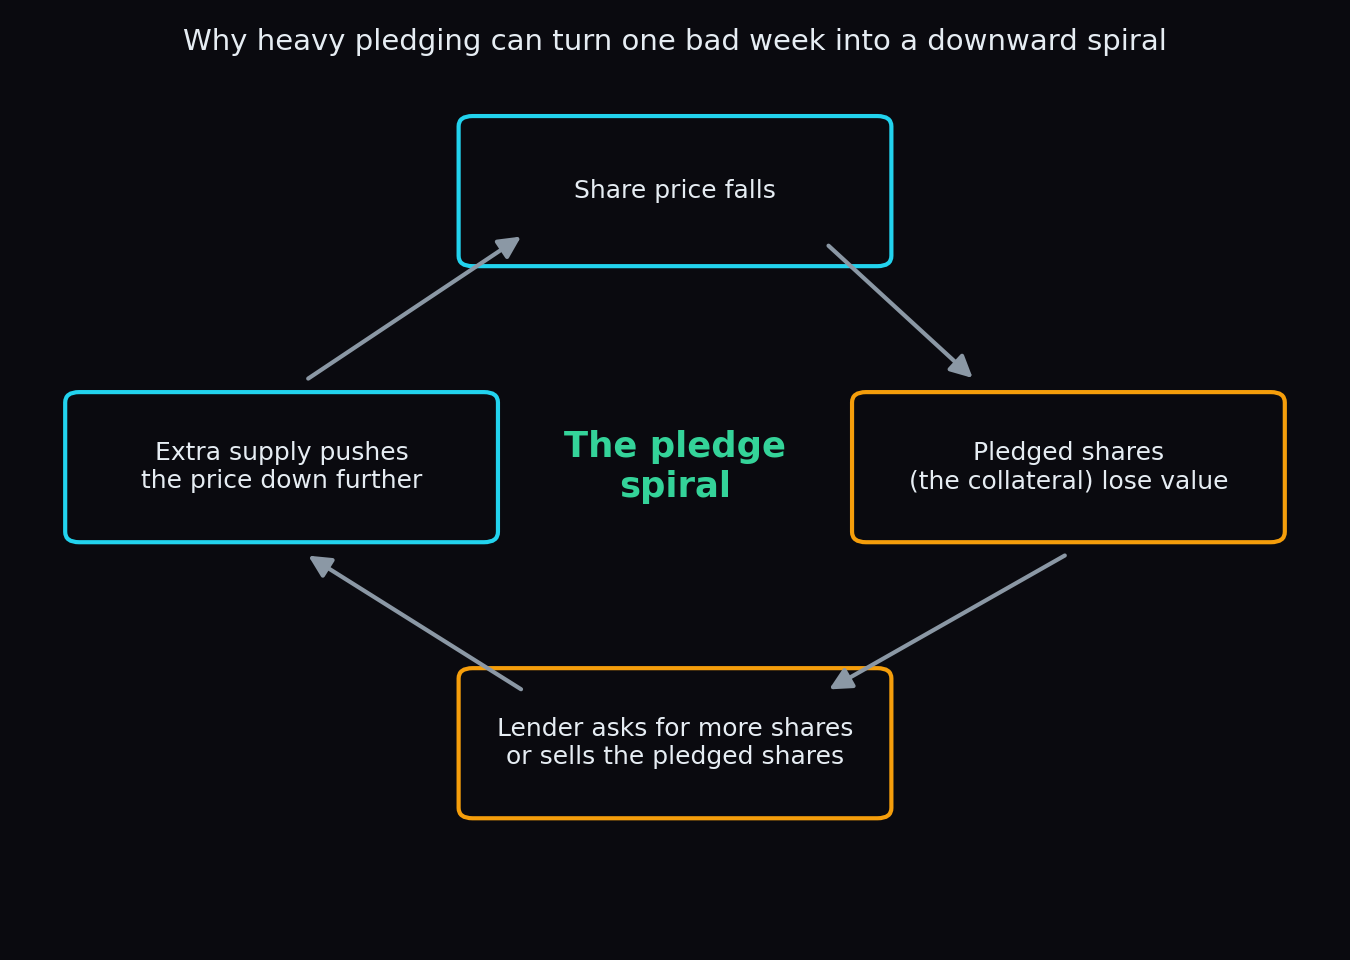
A falling price shrinks the collateral, which triggers margin calls, which force sales, which add supply and push the price down further — which shrinks the collateral again. The original fall might have nothing to do with the business at all; a weak market month can start it. Heavy pledging turns an ordinary decline into a self-feeding one, and it can also end with the promoters losing part of their stake — the very skin in the game that made the company investable. This is why a stock with heavily pledged promoter shares often falls harder and faster than its business results alone would justify.
The red flags, in order of seriousness
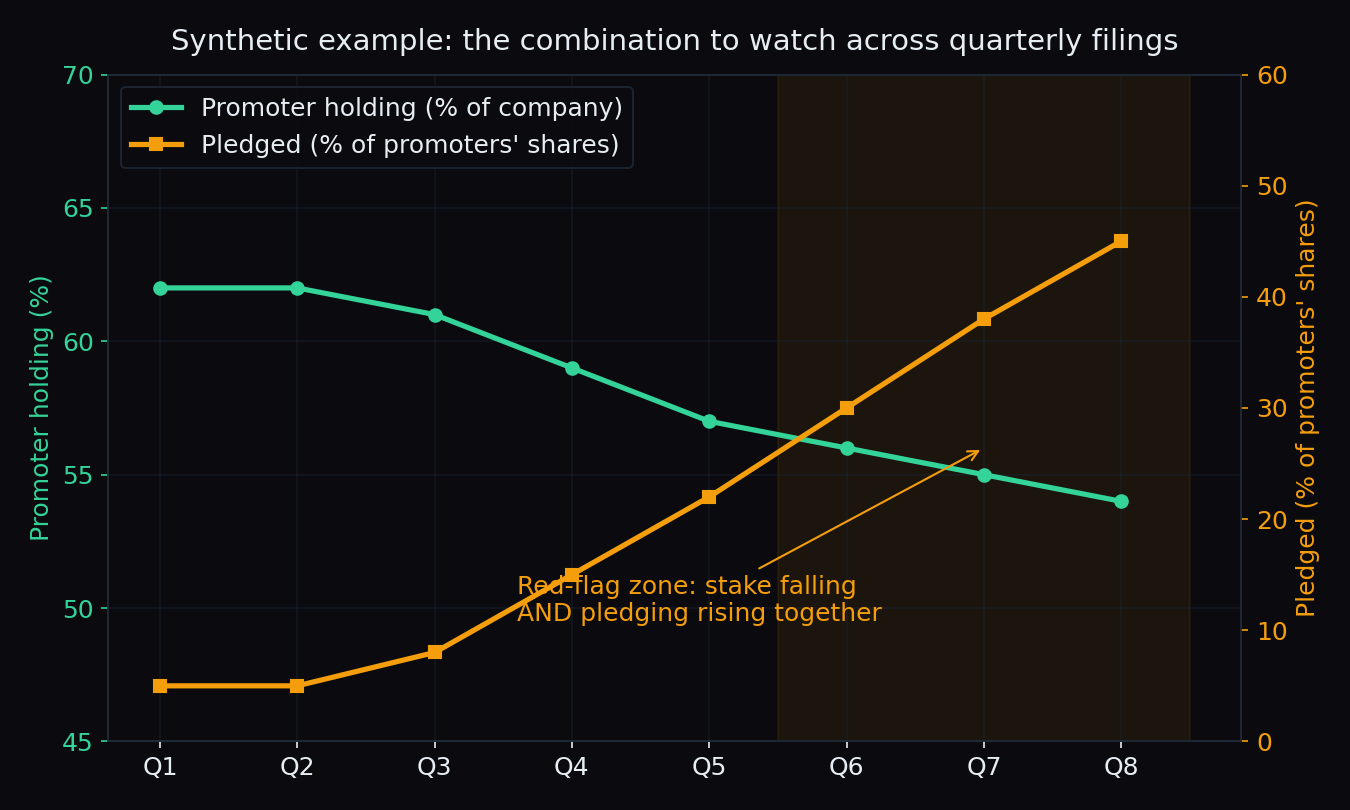
- A high pledge percentage. A small pledge (a few percent of the promoters' shares) is common and usually harmless. As the pledged share of the promoter stake grows large, the margin-call risk described above grows with it.
- Pledging that rises quarter after quarter. A rising line suggests the promoters keep needing new money and have run out of other sources — banks usually treat shares as collateral of last resort.
- Falling holding and rising pledges together. The combination in the chart above is the classic warning: the stake is shrinking while what remains is increasingly mortgaged.
- Pledging plus a stretched balance sheet. If the company itself also carries heavy debt — check the debt-to-equity ratio — then both the business and its owners are leveraged to the same share price. Stress hits both at once.
Key takeaway: promoter holding and pledging will not tell you whether a business is good. They tell you how much forced, price-insensitive selling could appear if things go wrong — and that risk is invisible in the profit and loss statement.
Where to find the numbers
Every listed company files a shareholding pattern each quarter, and it is public. You can read it on the NSE or BSE website under the company's filings, or in the company's own annual report; pledge details of promoter shares are disclosed alongside. Most free screener websites also display promoter holding and pledge percentages as ready-made columns, which makes the quarterly trend easy to scan in seconds.
The honest catch
- High promoter holding is not automatically good. A 75% stake also means a small public float and a dominant owner; governance quality still decides whether minority shareholders are treated fairly.
- Pledging is not automatically bad. Promoters sometimes pledge shares to fund a genuine expansion, a new venture, or a personal need unrelated to the company. A modest, stable pledge with a clear explanation is very different from a large, growing one.
- A falling stake has innocent explanations too. New shares issued to raise capital dilute the promoters' percentage without them selling anything. Check why the number moved before concluding anything.
- The data is quarterly and backward-looking. A pledge created last week may not be visible in the latest pattern yet, and a spiral can play out between two filings.
None of this replaces studying the business itself. But promoter holding and pledging are among the fastest checks in investing: two numbers, four quarters of history, and you know whether the people who control the company are anchored to it — or borrowing against the exit.
TrueTrend exists for exactly this kind of clarity: turning market structure into an at-a-glance read across Nifty, Bank Nifty and F&O, with its own track record scored in public. Create a free account to see today's picture.
See these concepts on live market data — free
Create a free TrueTrend account to watch daily support/resistance levels, market regime, and option-positioning charts on NIFTY, BankNifty and 12 more instruments. Every level we publish is scored on a public scoreboard — misses included. No card required.
Free forever tier · daily levels with published hit-rates across every instrument. Descriptive market structure, not investment advice.
Not ready for an account? Get the daily levels by email.
One short email each market day — the indices' call wall, put wall, gamma flip and max pain, and how the last session's levels scored. Free, no account, unsubscribe anytime.
Descriptive market structure, not investment advice. We never share your email.