Renko Charts Explained: Filtering Time Out of Price
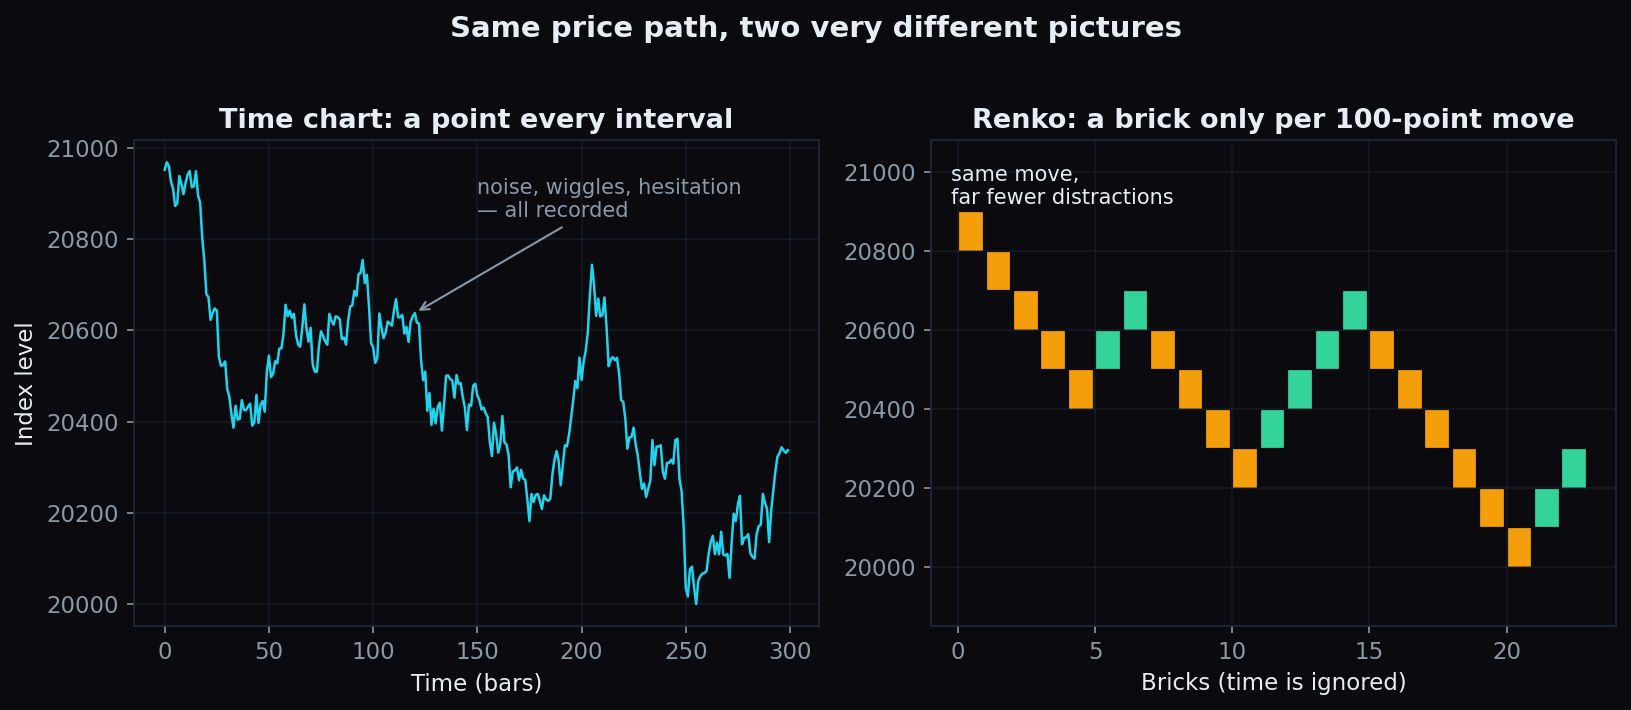
A 5-minute candlestick chart prints a new candle every 5 minutes, even when the price barely moves. A renko chart does the opposite: it prints a new brick only when price travels a fixed distance — say 100 points — and it ignores the clock completely. That one change turns a jittery squiggle into a clean staircase.
What is a renko chart?
“Renko” comes from renga, the Japanese word for brick. A renko chart is built from bricks that are all exactly the same size in price terms. An up-brick prints when price rises by one full brick; a down-brick prints when price falls far enough the other way (the exact rule is below). Time plays no role at all: the horizontal axis simply counts bricks.
Think of it as a step counter versus a clock. A normal chart is a clock — it records a bar every interval whether or not anything happened. A renko chart is a step counter — it only ticks when you actually move. Ten quiet minutes add ten candles to a 1-minute candlestick chart; they add nothing to a renko chart.
How bricks form: a worked example
Say an index trades at 20,000 and the brick size is 100 points.
- Price climbs to 20,100. That is one full brick of distance, so brick 1 prints, covering 20,000–20,100.
- Price grinds on to 20,230. Crossing 20,200 completes brick 2 (20,100–20,200). The extra 30 points stay unused — there are no partial bricks.
- Price slips back to 20,150. Nothing prints. A standard renko chart reverses only after price moves two full bricks against the last one — here, a fall from 20,200 all the way down to 20,000. An 80-point wobble is treated as noise and simply disappears.
- Price recovers and crosses 20,300, so brick 3 prints. The dip never appears on the chart at all.
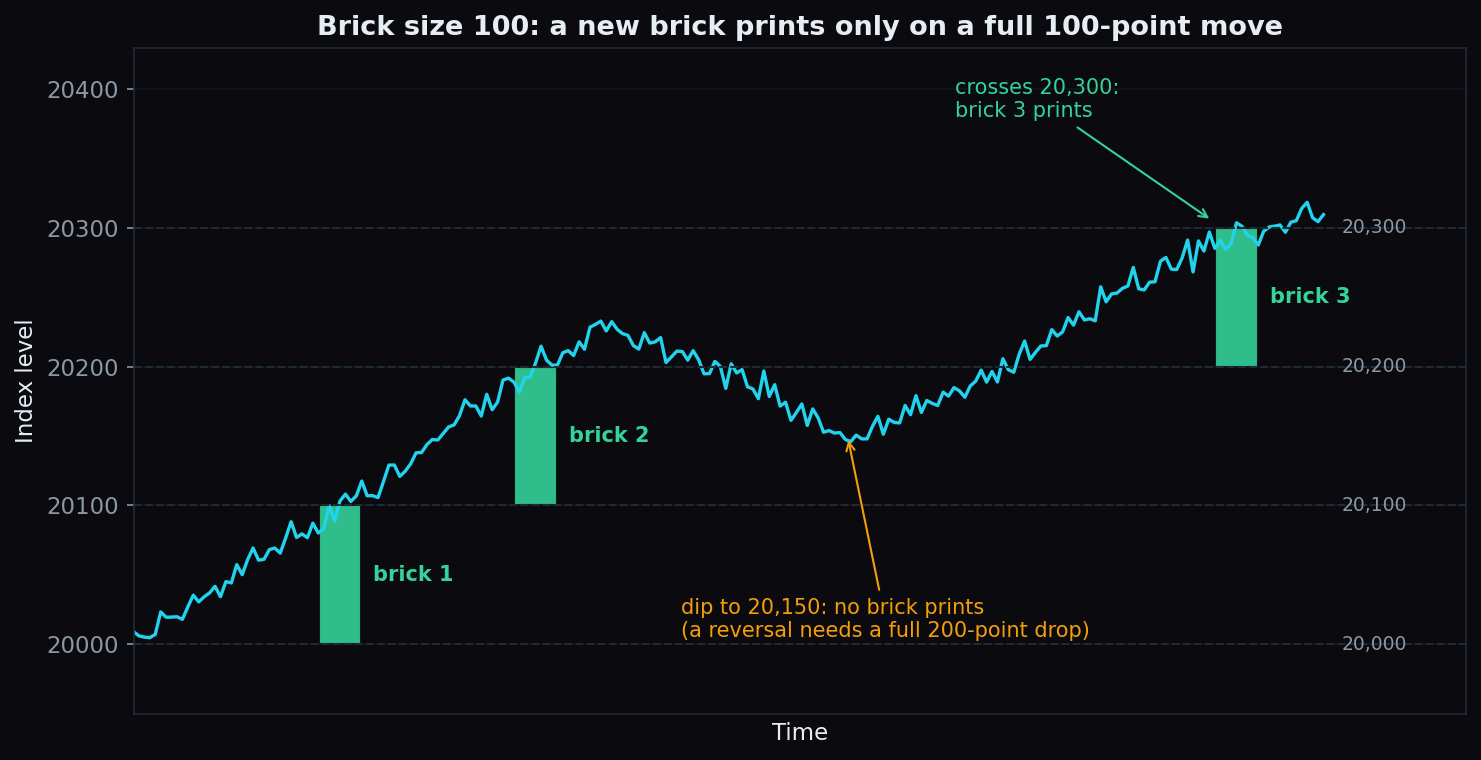
Two rules, then, cover everything: a new brick in the same direction needs one full brick of movement, and a reversal needs two. One side effect surprises beginners: bricks carry uneven timestamps. One brick may form in three minutes; the next may take three days. The chart looks perfectly even, but the clock behind it is not.
Why traders like the brick view
- Noise is filtered out. Small wiggles never reach the chart, so there is less temptation to react to every twitch.
- Trends look like staircases. A run of same-coloured bricks is easy to see at a glance, which makes trending phases and their endings stand out.
- Levels stand out. Bricks sit on a fixed price grid, so zones where price repeatedly stalls are easier to spot — the same idea behind support and resistance.
Choosing a brick size
The brick size is the whole game. Too small — say 10 points on a 20,000 index — and the noise you were filtering comes straight back. Too big — say 500 points — and the chart prints a brick or two a week and confirms every turn hopelessly late. Two common approaches:
- Fixed size: a round number in the region of 0.3–0.5% of the index level, kept constant so bricks stay comparable over time.
- ATR-based: set the brick to the Average True Range (ATR), a measure of recent daily movement, so the brick adapts as volatility rises and falls.
Renko vs candlesticks vs Heikin-Ashi
- Candlesticks keep everything: open, high, low, close and time. Maximum information, maximum noise.
- Heikin-Ashi smooths candles by averaging their values, but still prints one candle per interval — the clock stays.
- Renko removes time entirely and keeps only distance. It is the most aggressive filter of the three, and the one that discards the most information.
The honest catch
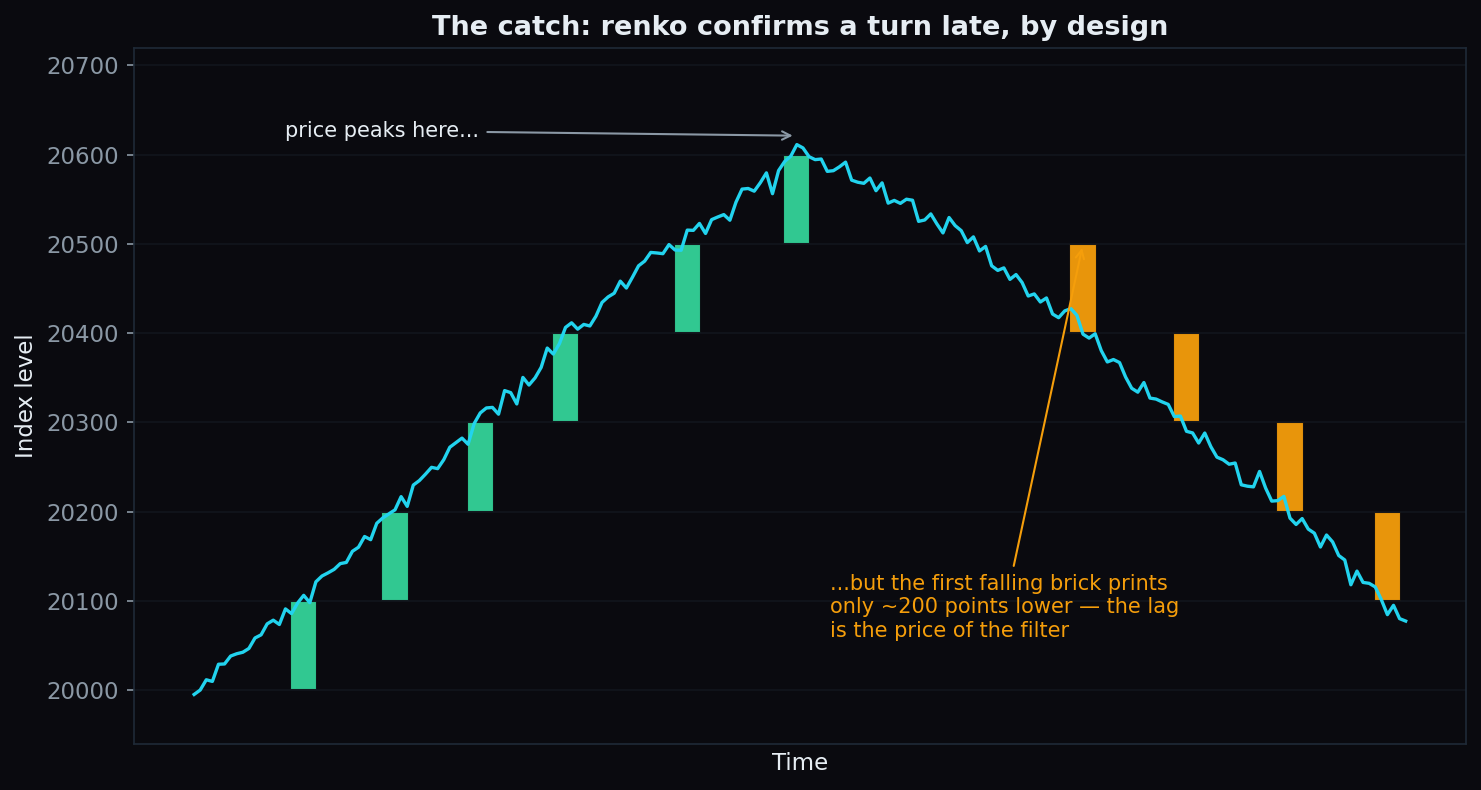
- It confirms late, by design. A reversal needs two full bricks. In our example the first falling brick prints roughly 200 points below the peak — that lag is the fee the filter charges on every single turn.
- It hides information. Time, gaps and volume vanish. An overnight gap through three brick levels prints as three calm-looking bricks, as if the move were smooth.
- History looks cleaner than the live chart felt. Old bricks are only drawn once complete. Live, the current brick keeps redrawing, and price can sit far from the last printed brick while you wait.
- The wrong brick size still whipsaws. Renko does not remove choppy markets; it only hides chop smaller than the brick.
The fair summary: a renko chart changes what you see, not what the market does. It is a lens, not an edge — and every lens throws some light away.
Charts describe the past; positioning shows where traders are committed right now. TrueTrend turns Nifty & Bank Nifty option positioning into one clear, at-a-glance read — and it scores its own levels in public. The Nifty 50 call wall (a strike where heavy option positioning often acts as a ceiling) has held on 76% of touches so far (n=21). See the live track record on the TrueTrend scoreboard.
See these concepts on live market data — free
Create a free TrueTrend account to watch daily support/resistance levels, market regime, and option-positioning charts on NIFTY, BankNifty and 12 more instruments. Every level we publish is scored on a public scoreboard — misses included. No card required.
Free forever tier · daily levels with published hit-rates across every instrument. Descriptive market structure, not investment advice.
Not ready for an account? Get the daily levels by email.
One short email each market day — the indices' call wall, put wall, gamma flip and max pain, and how the last session's levels scored. Free, no account, unsubscribe anytime.
Descriptive market structure, not investment advice. We never share your email.