DuPont Analysis: Breaking ROE into Margin, Turnover and Leverage
Two companies both report a return on equity (ROE) of 10%. One is a jeweller earning fat profit on stock that moves slowly; the other is a grocery chain earning wafer-thin profit on goods that fly off the shelf every day. The headline number is identical, yet the businesses could hardly be more different. DuPont analysis is the simple technique that splits ROE into three parts — profit margin, asset turnover and leverage — so you can see which engine is actually producing the return. This post explains the split with round numbers and shows why two identical ROEs can carry two very different levels of risk.
First, a quick recap: what ROE measures
ROE = net profit ÷ shareholders’ equity. Two terms to define:
- Net profit is what is left of a year’s revenue after every cost — raw materials, wages, interest, tax — has been paid.
- Shareholders’ equity is the owners’ money in the business: what shareholders originally put in, plus all the profit kept back and reinvested over the years.
An ROE of 10% means every ₹100 of owners’ money produced ₹10 of profit that year. It is one of the most quoted numbers in fundamental research — we cover the basics (and its cousin ROCE) in our ROE and ROCE explainer. The problem is that ROE is a single dial. It tells you how fast, not why.
The DuPont idea: three dials behind one number
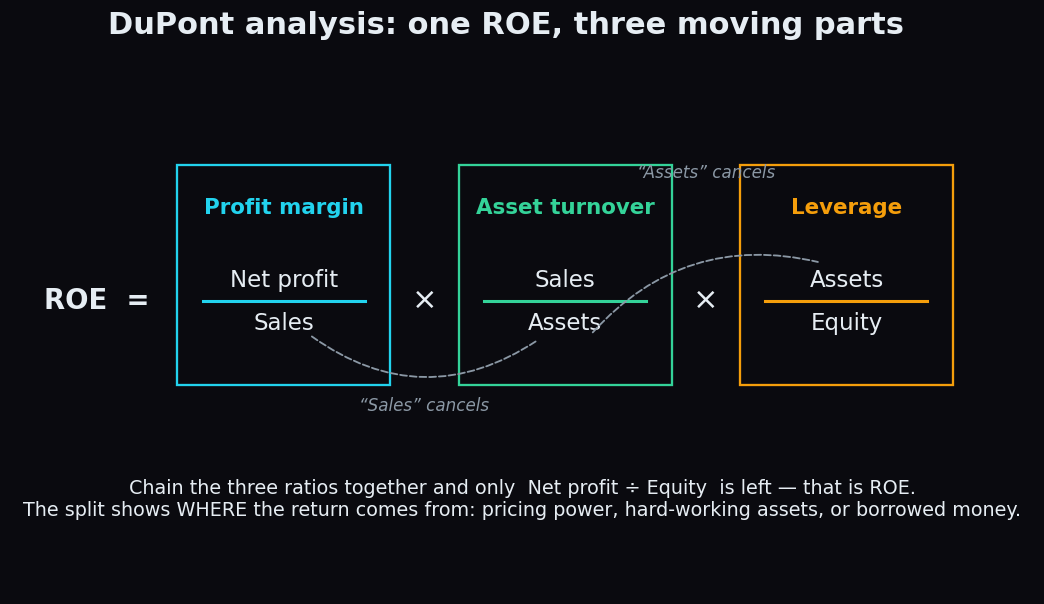
Think of ROE as a car’s speed reading. Two cars can both show 80 km/h — one cruising downhill in fifth gear, the other screaming uphill in second. Same speed, very different engines, very different stress. DuPont analysis, first used inside the DuPont corporation in the 1920s, opens the dashboard. It rewrites ROE as a chain of three ratios:
ROE = (Net profit ÷ Sales) × (Sales ÷ Assets) × (Assets ÷ Equity)
Notice the trick: “Sales” appears on the bottom of the first fraction and the top of the second, so it cancels. “Assets” cancels the same way. Chain the three together and only Net profit ÷ Equity remains — plain ROE. Nothing has been added or removed; the number has simply been split into three named parts:
- Profit margin (Net profit ÷ Sales): how many paise of profit the company keeps from every rupee of sales. This dial measures pricing power and cost control.
- Asset turnover (Sales ÷ Assets): how hard the company works its assets — how many rupees of sales each rupee of factories, shops and stock generates in a year. This dial measures efficiency.
- Leverage (Assets ÷ Equity): how much of the business is funded by other people’s money. If assets are twice equity, half the business is financed by borrowings and other liabilities. This dial measures balance-sheet risk.
A worked example: the jeweller and the grocer
Round numbers, two shops:
- The jeweller: sales ₹100 crore, net profit ₹10 crore — a 10% margin. But jewellery sits in the display case for months, so assets are a heavy ₹200 crore: turnover is 100 ÷ 200 = 0.5×. Equity is ₹100 crore, so leverage is 200 ÷ 100 = 2×.
- The grocer: sales ₹500 crore, net profit ₹10 crore — a skinny 2% margin. But stock flies off the shelf, so the same ₹200 crore of assets produces 2.5× turnover. Leverage is the same 2×.
Now chain each set of dials:
- Jeweller: 10% × 0.5 × 2.0 = 10% ROE
- Grocer: 2% × 2.5 × 2.0 = 10% ROE
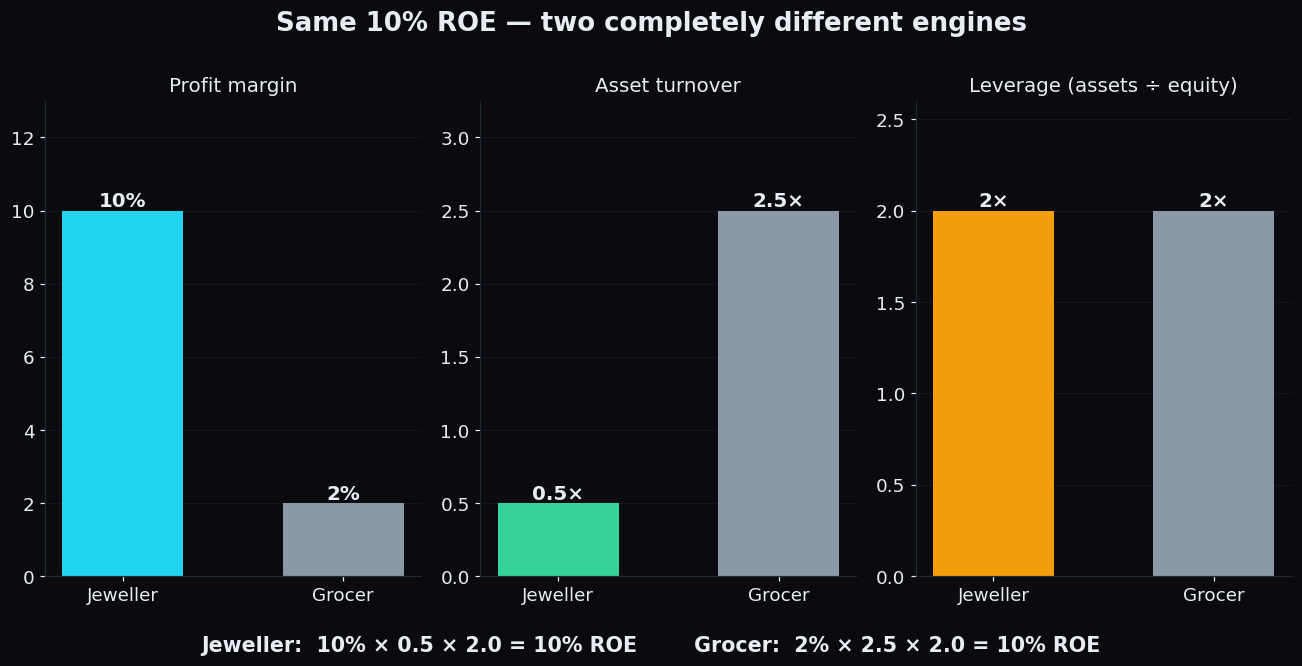
Identical ROE, opposite engines. The jeweller earns its return through margin; the grocer earns it through speed. That distinction changes what you watch next. For the jeweller, the question is whether pricing power holds — a small margin squeeze hurts a lot. For the grocer, the question is footfall and shelf speed — a small slowdown in turnover hurts a lot. One headline number hid all of that.
The third dial: leverage deserves extra respect
Margin and turnover describe how good the business is. Leverage describes how the business is funded — and it can inflate ROE without the business improving at all.
Take the same jeweller and let it borrow heavily until assets are four times equity instead of two. Margin and turnover are unchanged, yet ROE doubles: 10% × 0.5 × 4.0 = 20%. On a screen full of ROE numbers, this company now looks twice as good. Nothing about the shop changed — only the loan book did.
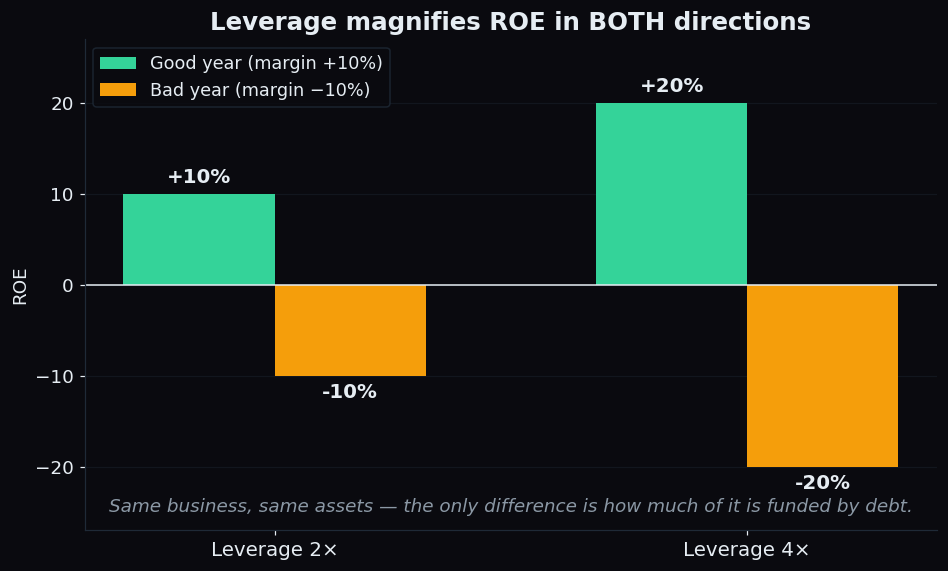
The catch is symmetry. Leverage magnifies bad years exactly as much as good ones: if the margin swings from +10% to −10% in a downturn, the 2×-leveraged shop posts −10% ROE while the 4×-leveraged one posts −20% — with lenders still expecting their interest on time. This is why a high ROE built on borrowings deserves more scepticism than the same ROE built on margin or turnover. Our debt-to-equity guide covers how to read borrowing levels in more depth.
Where to find the numbers
Everything comes from two documents every listed company publishes:
- Net profit and sales sit in the profit-and-loss statement — see our guide to reading the income statement.
- Total assets and shareholders’ equity sit in the balance sheet — see how to read a balance sheet.
Two practical habits: use consolidated figures so subsidiaries are included, and since the P&L covers a full year while the balance sheet is a single-day snapshot, analysts often use the average of opening and closing assets (and equity) for the year. Most screener websites compute the split for you, but working through it once by hand — as part of your broader fundamental analysis — is what makes the number mean something.
The honest catch
- It explains the past, not the future. DuPont tells you where last year’s return came from. It says nothing about whether that margin or turnover will repeat.
- Net profit can be flattered. A one-off gain (land sale, tax refund) sits inside net profit and inflates the margin dial for a year. Strip one-offs out before reading too much into a jump.
- Compare within an industry, not across. A grocer’s 2% margin is normal; a software firm’s 2% margin is a crisis. Each dial only means something next to peers and the company’s own history.
- Banks and NBFCs are different animals. Lenders run high leverage by design — deposits and borrowings are their raw material — so their DuPont mix looks alarming next to a manufacturer and should only ever be compared within the financial sector.
- Negative equity breaks the maths. If accumulated losses have wiped out equity, ROE and the leverage dial stop meaning anything useful.
- A finer five-step version exists. It further splits the margin dial into operating, interest and tax effects. Same idea, thinner slices — useful once the three-part version feels natural.
Key takeaway: ROE tells you how fast the car is going; DuPont analysis opens the dashboard. Two identical ROEs can come from pricing power, from hard-working assets, or from borrowed money — and only the split tells you which one you are actually looking at.
Splitting one headline number into its honest parts is the whole spirit of good analysis — and it applies to markets, not just companies. TrueTrend does the same for index positioning: it turns Nifty and Bank Nifty derivatives data into a clear, at-a-glance read and scores its own signals in public, so you can see what actually held up before you rely on it. You can create a free account and judge the track record yourself.
See these concepts on live market data — free
Create a free TrueTrend account to watch daily support/resistance levels, market regime, and option-positioning charts on NIFTY, BankNifty and 12 more instruments. Every level we publish is scored on a public scoreboard — misses included. No card required.
Free forever tier · daily levels with published hit-rates across every instrument. Descriptive market structure, not investment advice.
Not ready for an account? Get the daily levels by email.
One short email each market day — the indices' call wall, put wall, gamma flip and max pain, and how the last session's levels scored. Free, no account, unsubscribe anytime.
Descriptive market structure, not investment advice. We never share your email.